
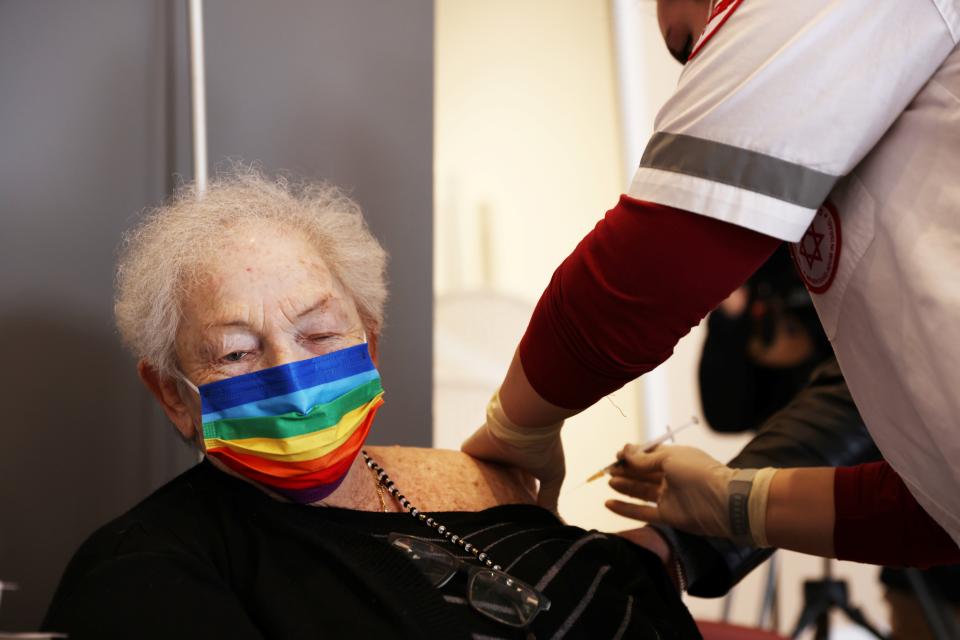
REUTERS/Ronen Zvulun
The data making important COVID decisions - from where to prioritize vaccinations to how to reopen businesses - has underlying demographic bias.
When cities like San Francisco, San Antonio, or Memphis want to identify local hot spots for the COVID-19 pandemic, or anticipate which hospitals could be overwhelmed, they often rely on mobility data that comes from smartphones.
The U.S. Centers for Disease Control uses mobility data to evaluate the effectiveness of social distancing policies. The state of California has used the same database to decide where to impose stay-at-home rules. Last September, researchers used it to show that the Sturgis Motorcycle Rally in Idaho had become a super-spreader event. More recently, The New York Times used the same data to declare that a business capacity limit of 20 percent was the “magic number” for curbing transmission.
But what if that data contains hidden demographic biases that under-represent the communities that may be most at risk?
Now, a study by researchers from Stanford and Carnegie-Mellon universities finds that the most widely used mobility database for COVID analysis does indeed under-count older people and especially older people of color — precisely the people who have most to fear from the novel coronavirus.
The reason for that under-representation, the researchers say, is that people older than 65 are less likely than younger people to carry smartphones or to turn on apps that relay their locations. Non-whites were also under-represented, and people who were both older and non-white were the least represented of all.
The results are likely to be important for a host of decisions in the months ahead, the researchers say. Those decisions could include where to prioritize vaccinations, where to ramp up testing, and how to reopen businesses.
The study, which will be published in the proceedings of the ACM Conference on Fairness, Accountability, and Transparency, also exposes the broader problem of hidden biases in the data that powers artificial intelligence (AI) models used in fields from criminal justice to automobile insurance. The challenge is that it’s difficult to cross-check the demographic accuracy of a dataset, especially at the most local levels, because it’s difficult to establish the “ground truth” against which it can be compared.
Cross-Checking the Data
The new study was led by Amanda Coston, a PhD candidate in machine learning at Carnegie-Mellon University (CMU), and co-authored by Daniel Ho, the William Benjamin Scott and Luna M. Scott Professor of Law at Stanford University and associate director of the Stanford Institute for Human-Centered Artificial Intelligence. The other co-authors were Alexandra Chouldechova, the Estella Loomis McCandless Assistant Professor of Statistics and Public Policy at CMU; Derek Ouyang, program manager of Stanford’s Future Bay Initiative; Neel Guha, a joint JD/PhD student in computer science at Stanford; and Lisa Lu, a fellow at Stanford’s RegLab.
The key innovation was to cross-check a cell phone mobility dataset used by many COVID researchers against actual measures of in-person traffic: precinct-level election day voting records. The researchers worked with voting data from North Carolina, which tracks the age, gender, race, and local precinct of every voter. The data encompassed almost 600,000 voters at more than 550 polling places, from schools and community centers to fire stations and churches.
Armed with those comparisons, the researchers were able to estimate statistical measures to offset the apparent under-representation.
“Having a large dataset, here of nearly 50 million cell phone devices, does not mean you don’t have to worry about representativeness,” Ho says. “That’s particularly important in the COVID context. While we have reasons to believe that there are demographic differences in smartphone usage, it’s hard to test the existence and extent of bias against ground truth.”
“There has been a lot written about algorithmic bias, but one of the most common reasons for bias is the data you’re using,” added Coston, of Carnegie-Mellon. “You want data that represents the whole population, or at least you want to understand the differences between your data and the population you’re trying to help.”
Statistical Counterweights
The mobility data at issue came from SafeGraph, a company that collects and analyzes the data from app providers. SafeGraph shares the data for free to government agencies and anyone else working on COVID-19 issues. Its database has been the go-to resource for the Centers for Disease Control, the governor of California, and cities across the United States.
SafeGraph published its own study of potential demographic biases earlier last year. That study found that its data was fairly representative at the state and county levels, but the company acknowledged uncertainty about the neighborhood level.
The Stanford and Carnegie-Mellon researchers sought to improve on that internal assessment. For one thing, they noted, the original study inferred representativeness on race and age from the aggregate demographics in census block groups. But aggregations like that can mask individual differences. Half of Atlanta’s population is African American, they noted, but African Americans might in fact represent a smaller share of individual smartphone users.
By comparing SafeGraph’s demographic estimates against the local voting data from North Carolina, the researchers estimated that traffic to a location with a younger, largely white visitor population was more than four times more likely to be represented in the company's data than traffic to a location with older, non-white visitors.
After measuring the demographic under-representation of those groups, the researchers suggest a potential statistical counterweight to offset the unintended bias in the mobility data.
“The first step is understanding the blind spots,” says Ho. “Once you can know the source of bias, you can start to correct for it.”
Stanford HAI's mission is to advance AI research, education, policy and practice to improve the human condition. Learn more.
More News Topics
Related Content

Treating COVID-19: How Researchers Are Using AI to Scale Care, Find Cures, and Crowdsource Solutions
Experts offer insights on combating the coronavirus during Stanford HAI's COVID-19 and AI Conference.
After COVID: The Future of Work, the Shifting Labor Market, and the Need for Safe 2020 Elections
Experts examine the economic and social ramifications of COVID during a Stanford HAI conference.
Quantifying the Value of Data
Stanford scholars propose a fair way to quantify how much individual datasets contribute to AI model performance and...