
The 2023 AI Index is out, covering the world of artificial intelligence from technical performance achievements, ethics advances, education and policy trends to economic impact, R&D, and the hiring and jobs scene.
The AI Index is an independent initiative at the Stanford Institute for Human-Centered Artificial Intelligence (HAI), led by the AI Index Steering Committee, an interdisciplinary group of experts from across academia and industry. It tracks, collates, distills, and visualizes data relating to artificial intelligence, enabling decision-makers to take meaningful action to advance AI responsibly and ethically with humans in mind.
TL;DR? Here, learn about the state of AI in 14 charts.
1: LLMs Scale Up
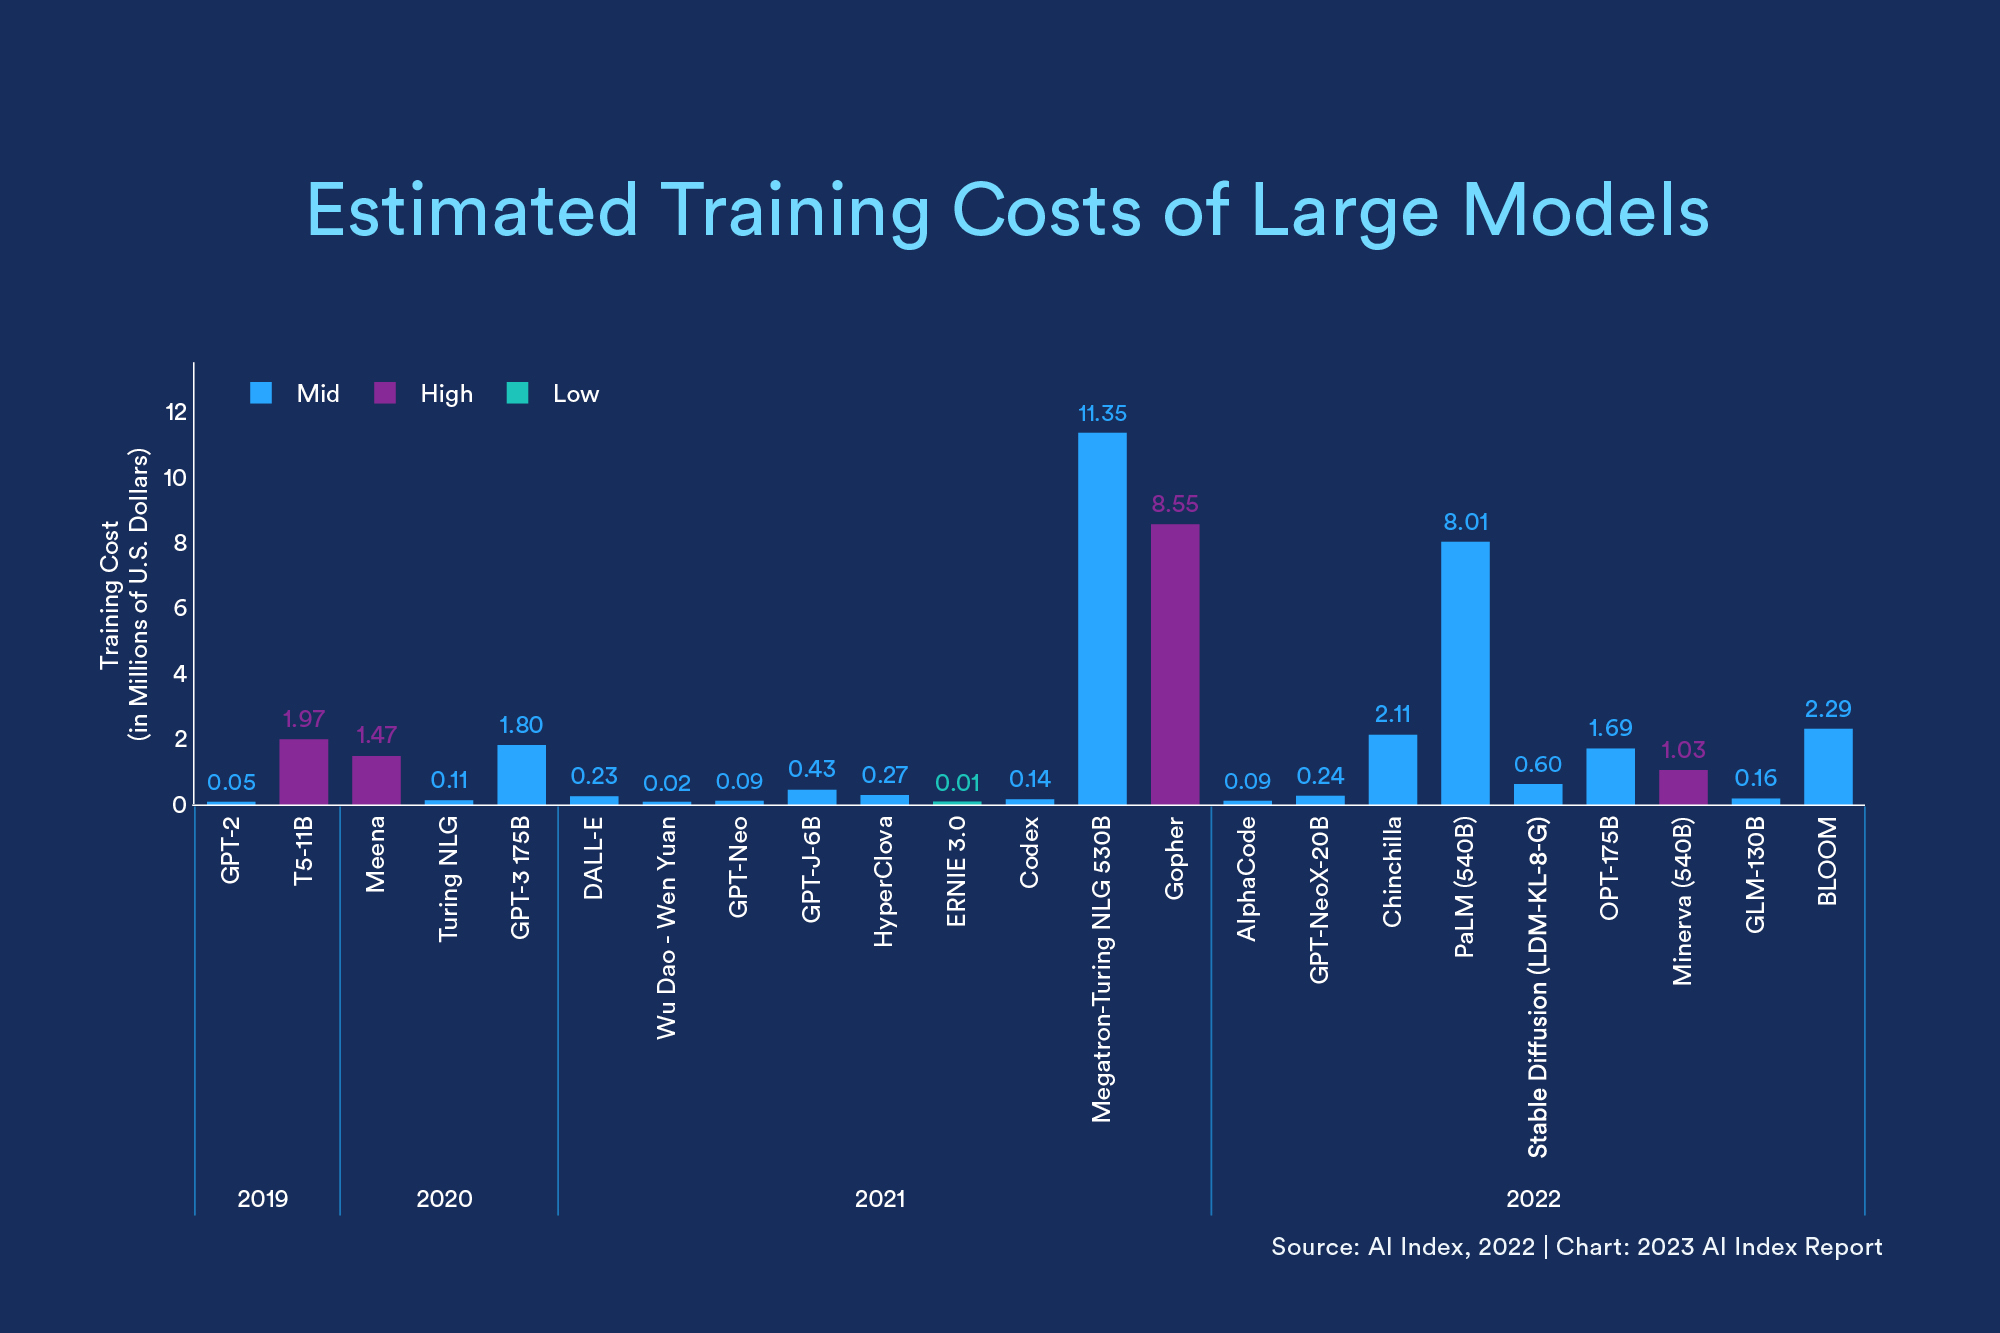
Large language models keep scaling in size and expense. GPT-2, released in 2019 and considered the first large language model, had 1.5 billion parameters and cost an estimated $50,000 to train. Just three years later, PaLM launched with 540 billion parameters and cost an estimated $8 million. It’s not just PaLM: Across the board, large language and multimodal models are becoming larger and pricier. (And since these are estimates, we've qualified them as mid, high, or low: mid where the estimate is thought to be a mid-level estimate, high where it is thought to be an overestimate, and low where it is thought to be an underestimate.)
2: New Benchmarks Needed
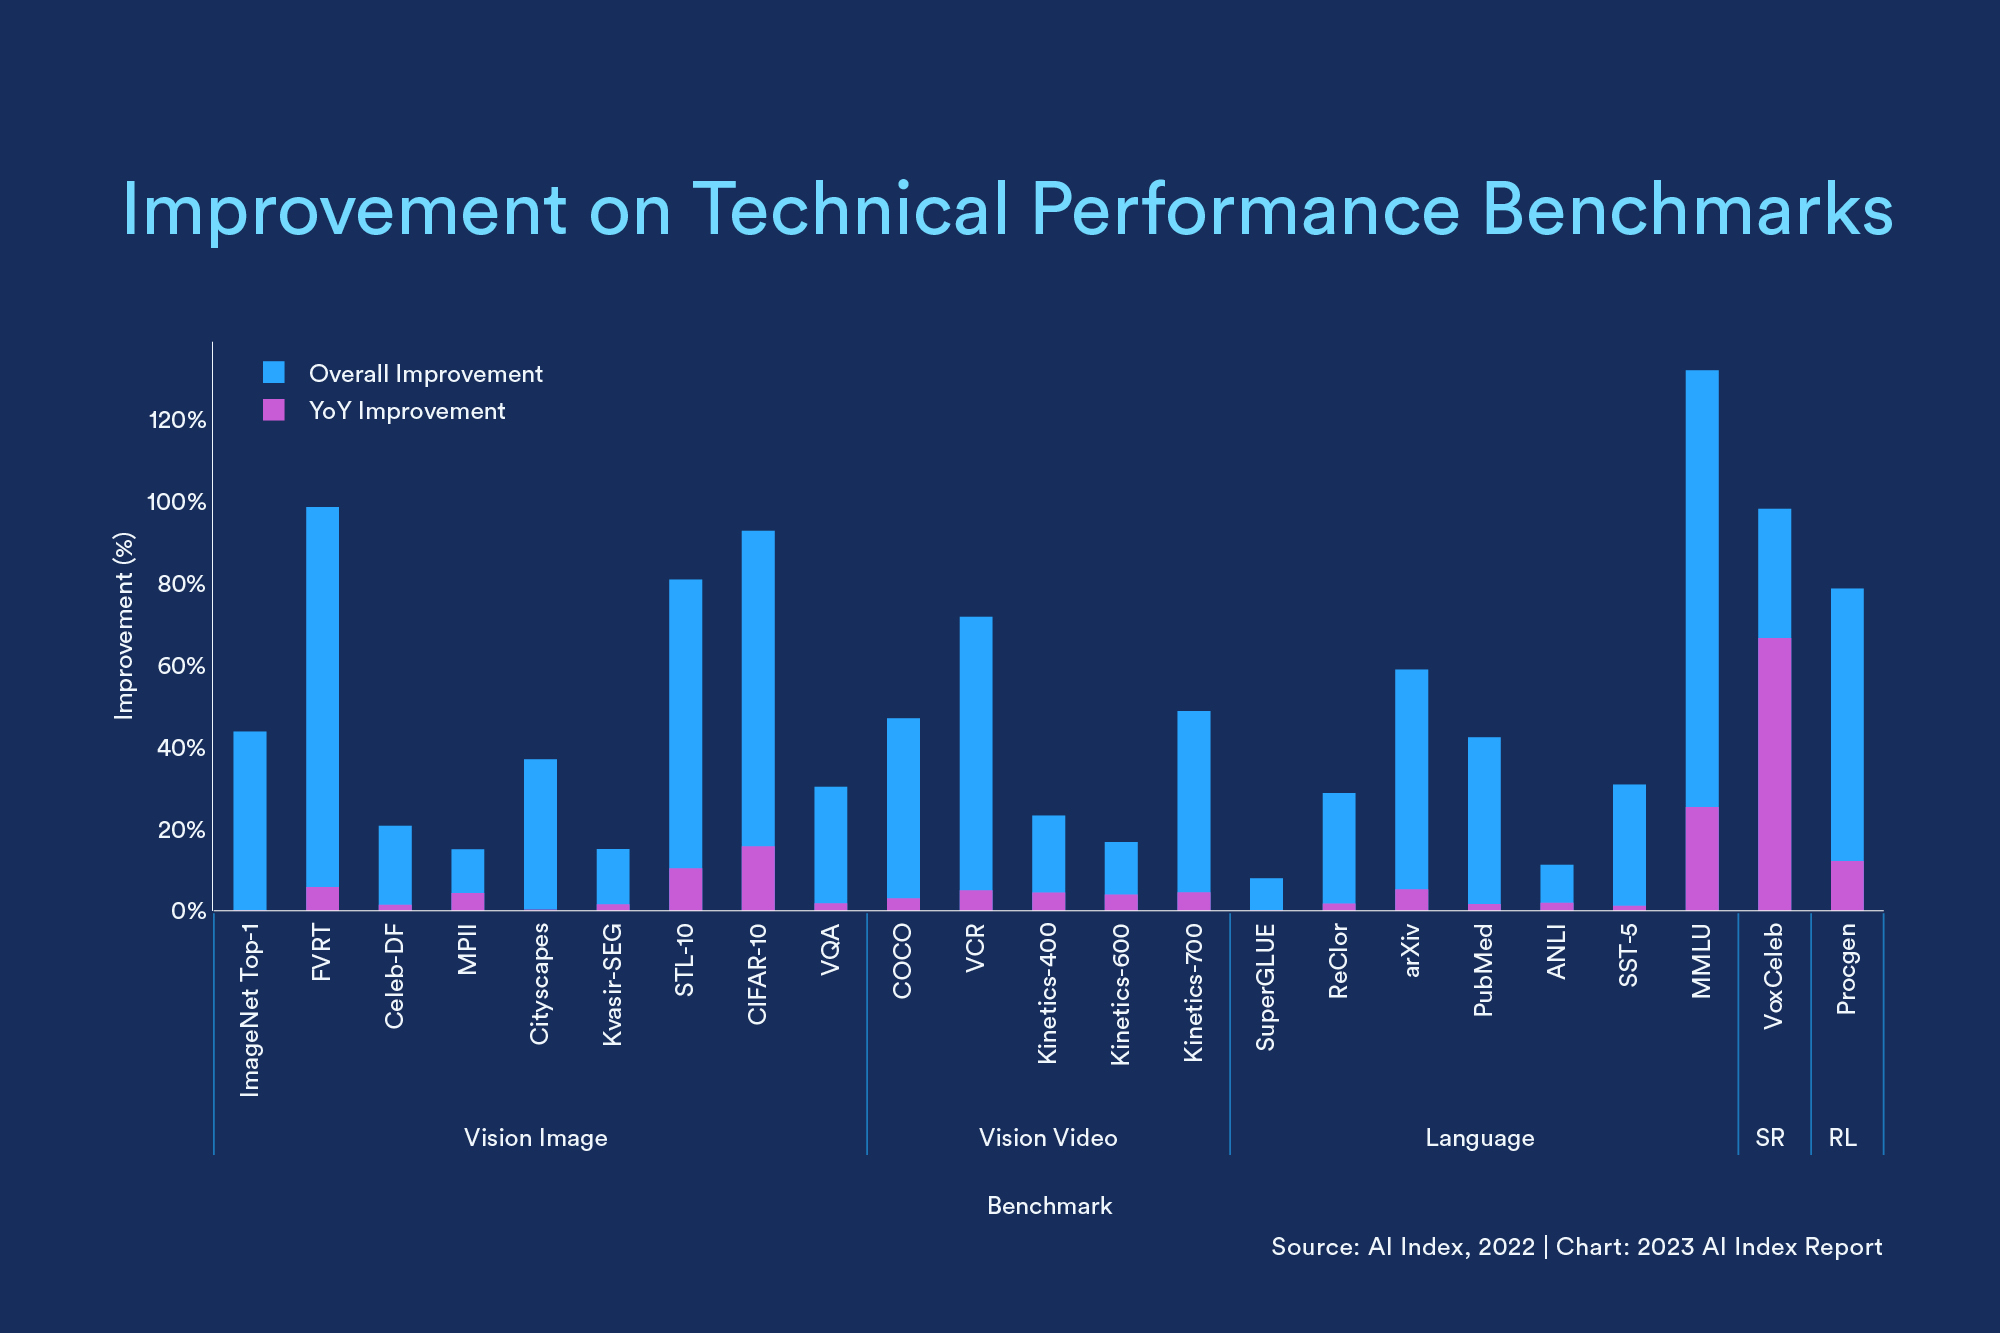
On the technical side, current AI tools keep meeting or beating benchmarks. While we saw benchmark saturation last year, this year the trend is much more pronounced. This shows us AI systems have become increasingly capable on older benchmarks and will require more difficult tests to be fully challenged. (Learn more about benchmark saturation from AI Index steering committee member Vanessa Parli.)
3: The High Environmental Costs of Training
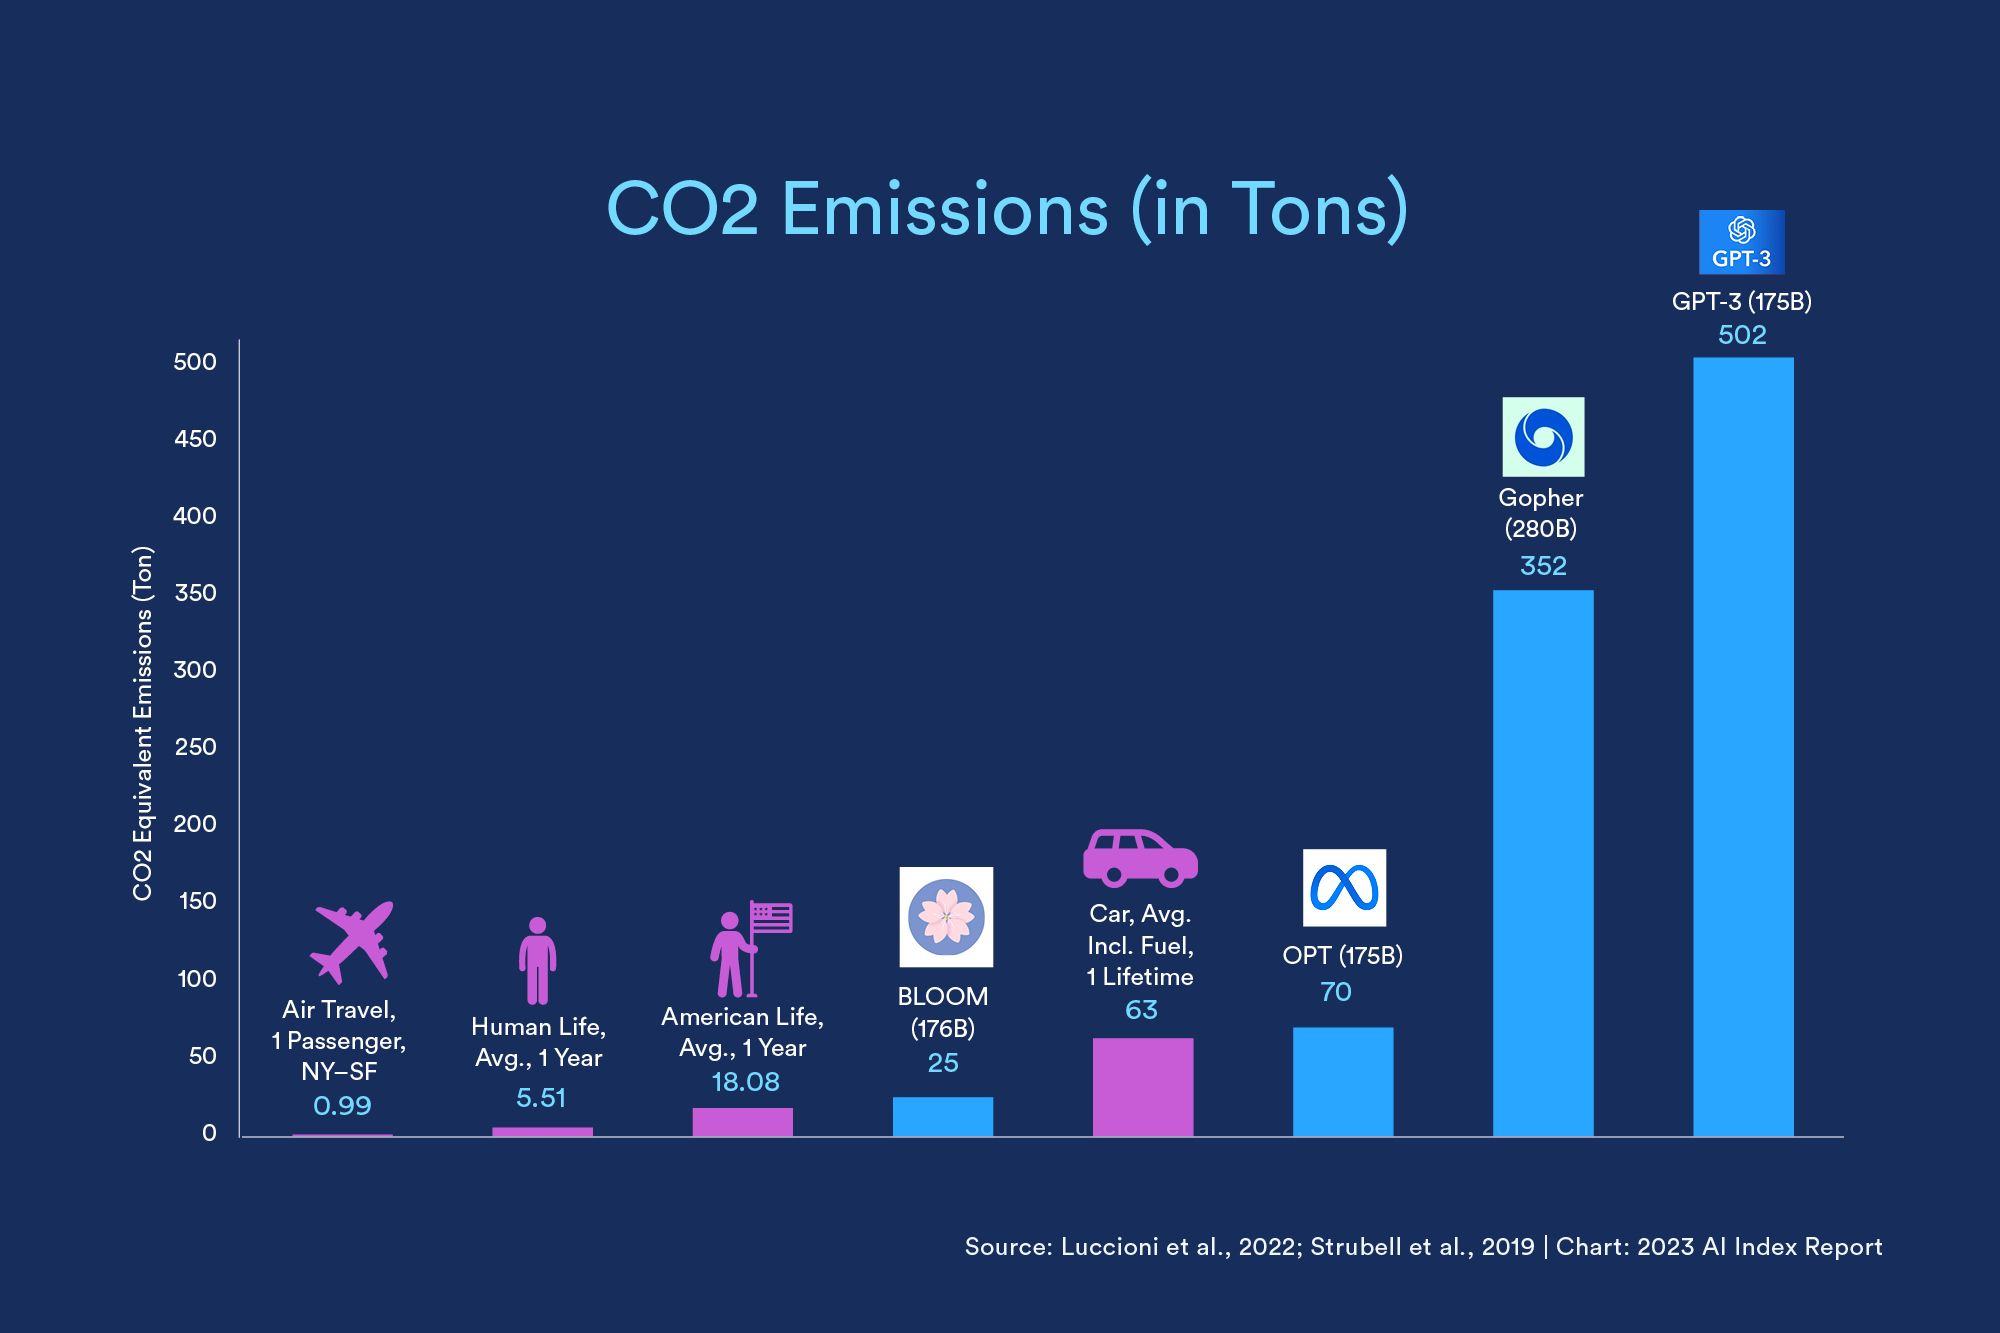
Big models emit big carbon emissions numbers – through large numbers of parameters in the models, power usage effectiveness of data centers, and even grid efficiency. The heaviest carbon emitter by far was GPT-3, but even the relatively more efficient BLOOM took 433 MWh of power to train, which would be enough to power the average American home for 41 years.
4: More AI, More Problems
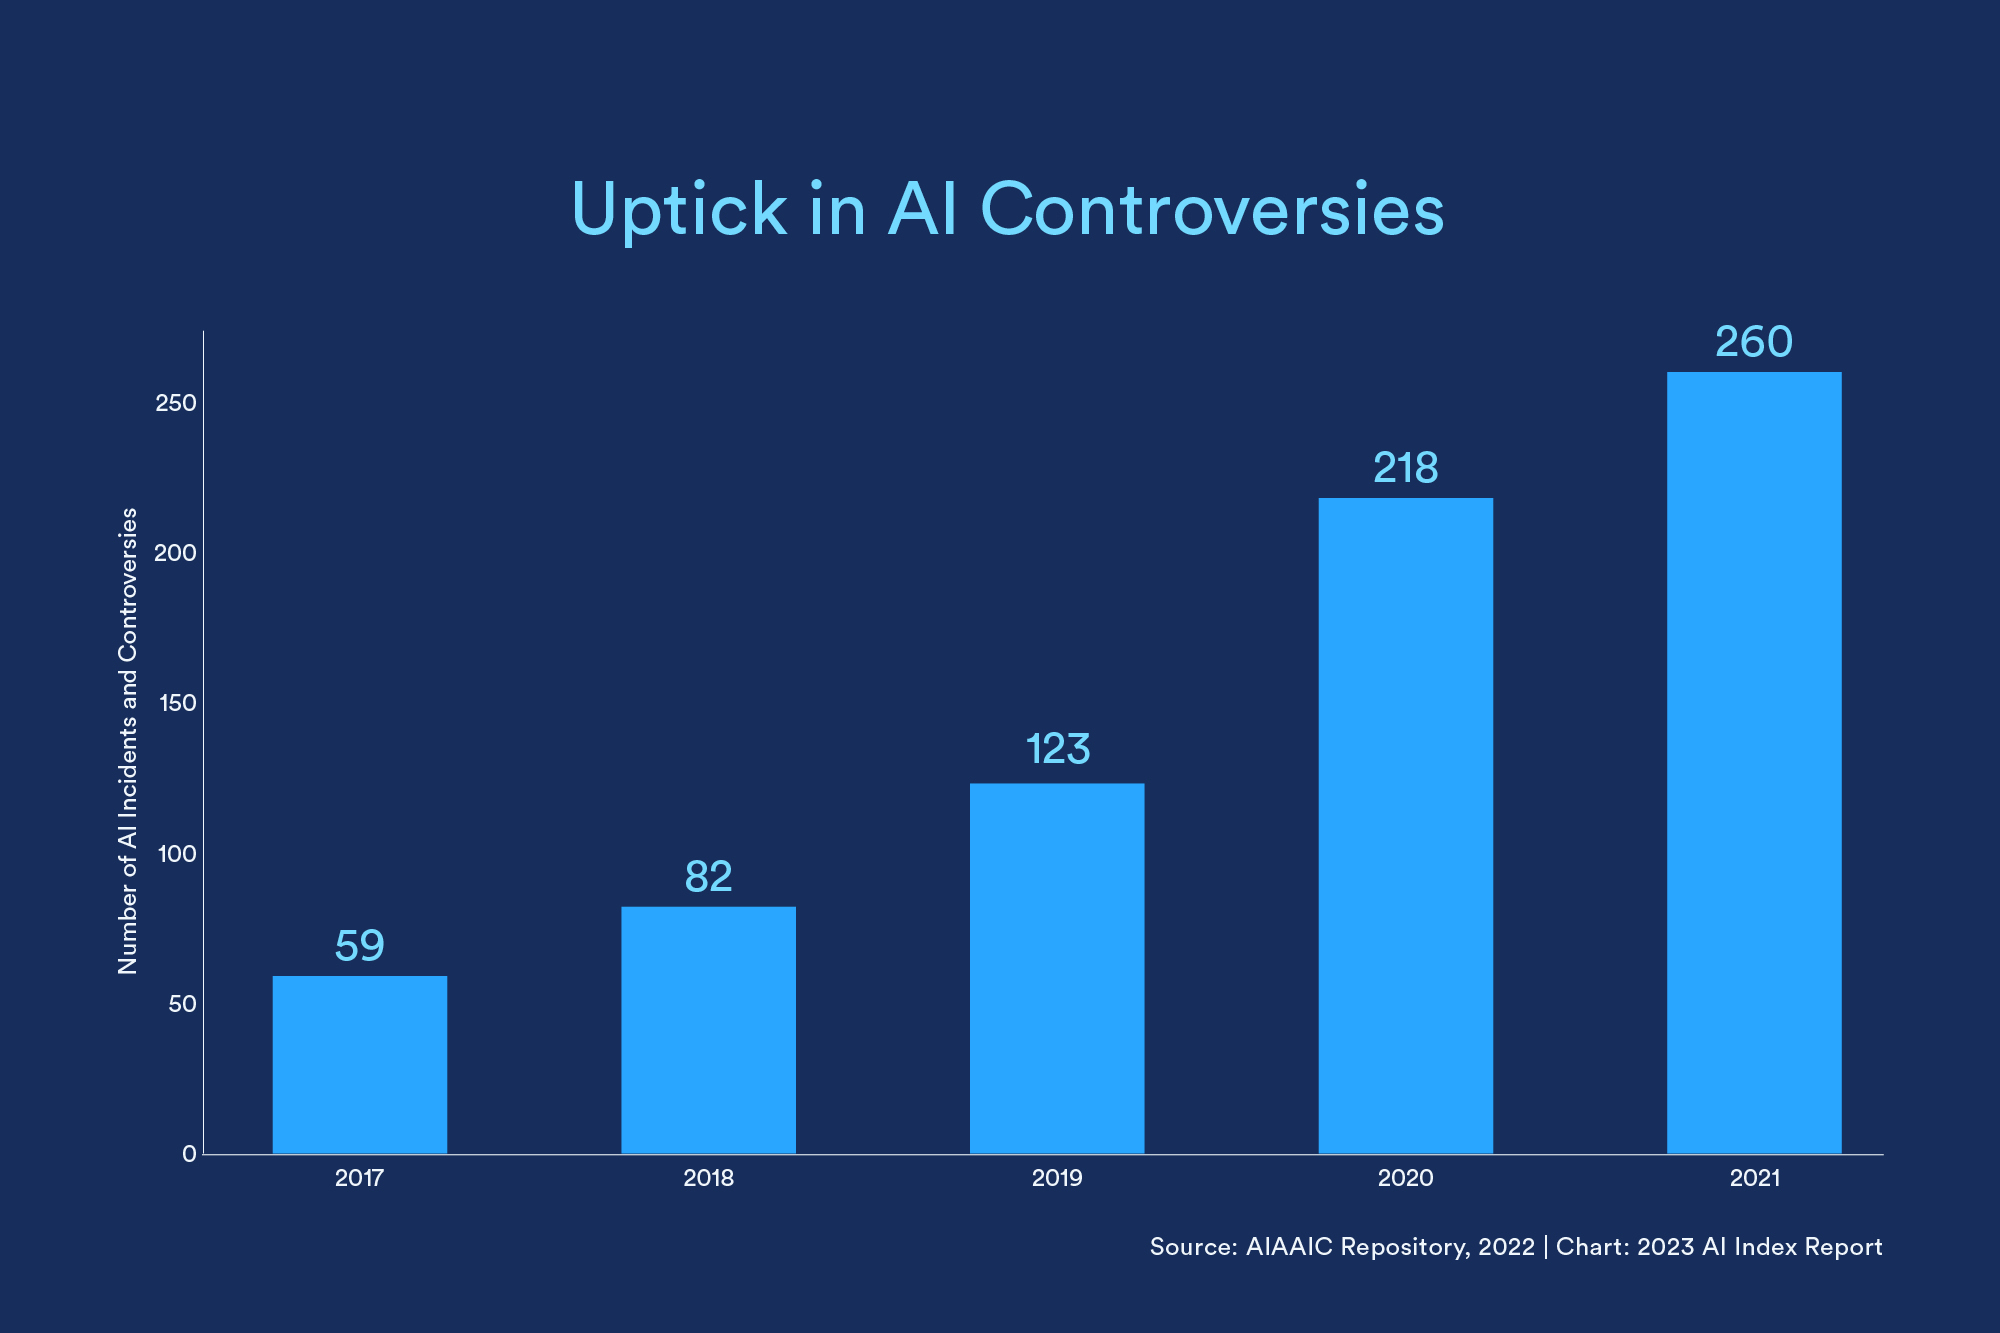
According to the AI, Algorithmic, and Automation Incidents and Controversies repository, reported issues are 26 times greater in 2021 than in 2012. Chalk that up to both an increase in AI use and a growing awareness of its misuse. Some of those reported issues included a deepfake of Ukrainian President Volodymyr Zelenskyy surrendering, face recognition technology to try to track gang members and rate their risk, and surveillance technology to scan and determine emotional states of students in a classroom.
5: More Ethics-Related Papers
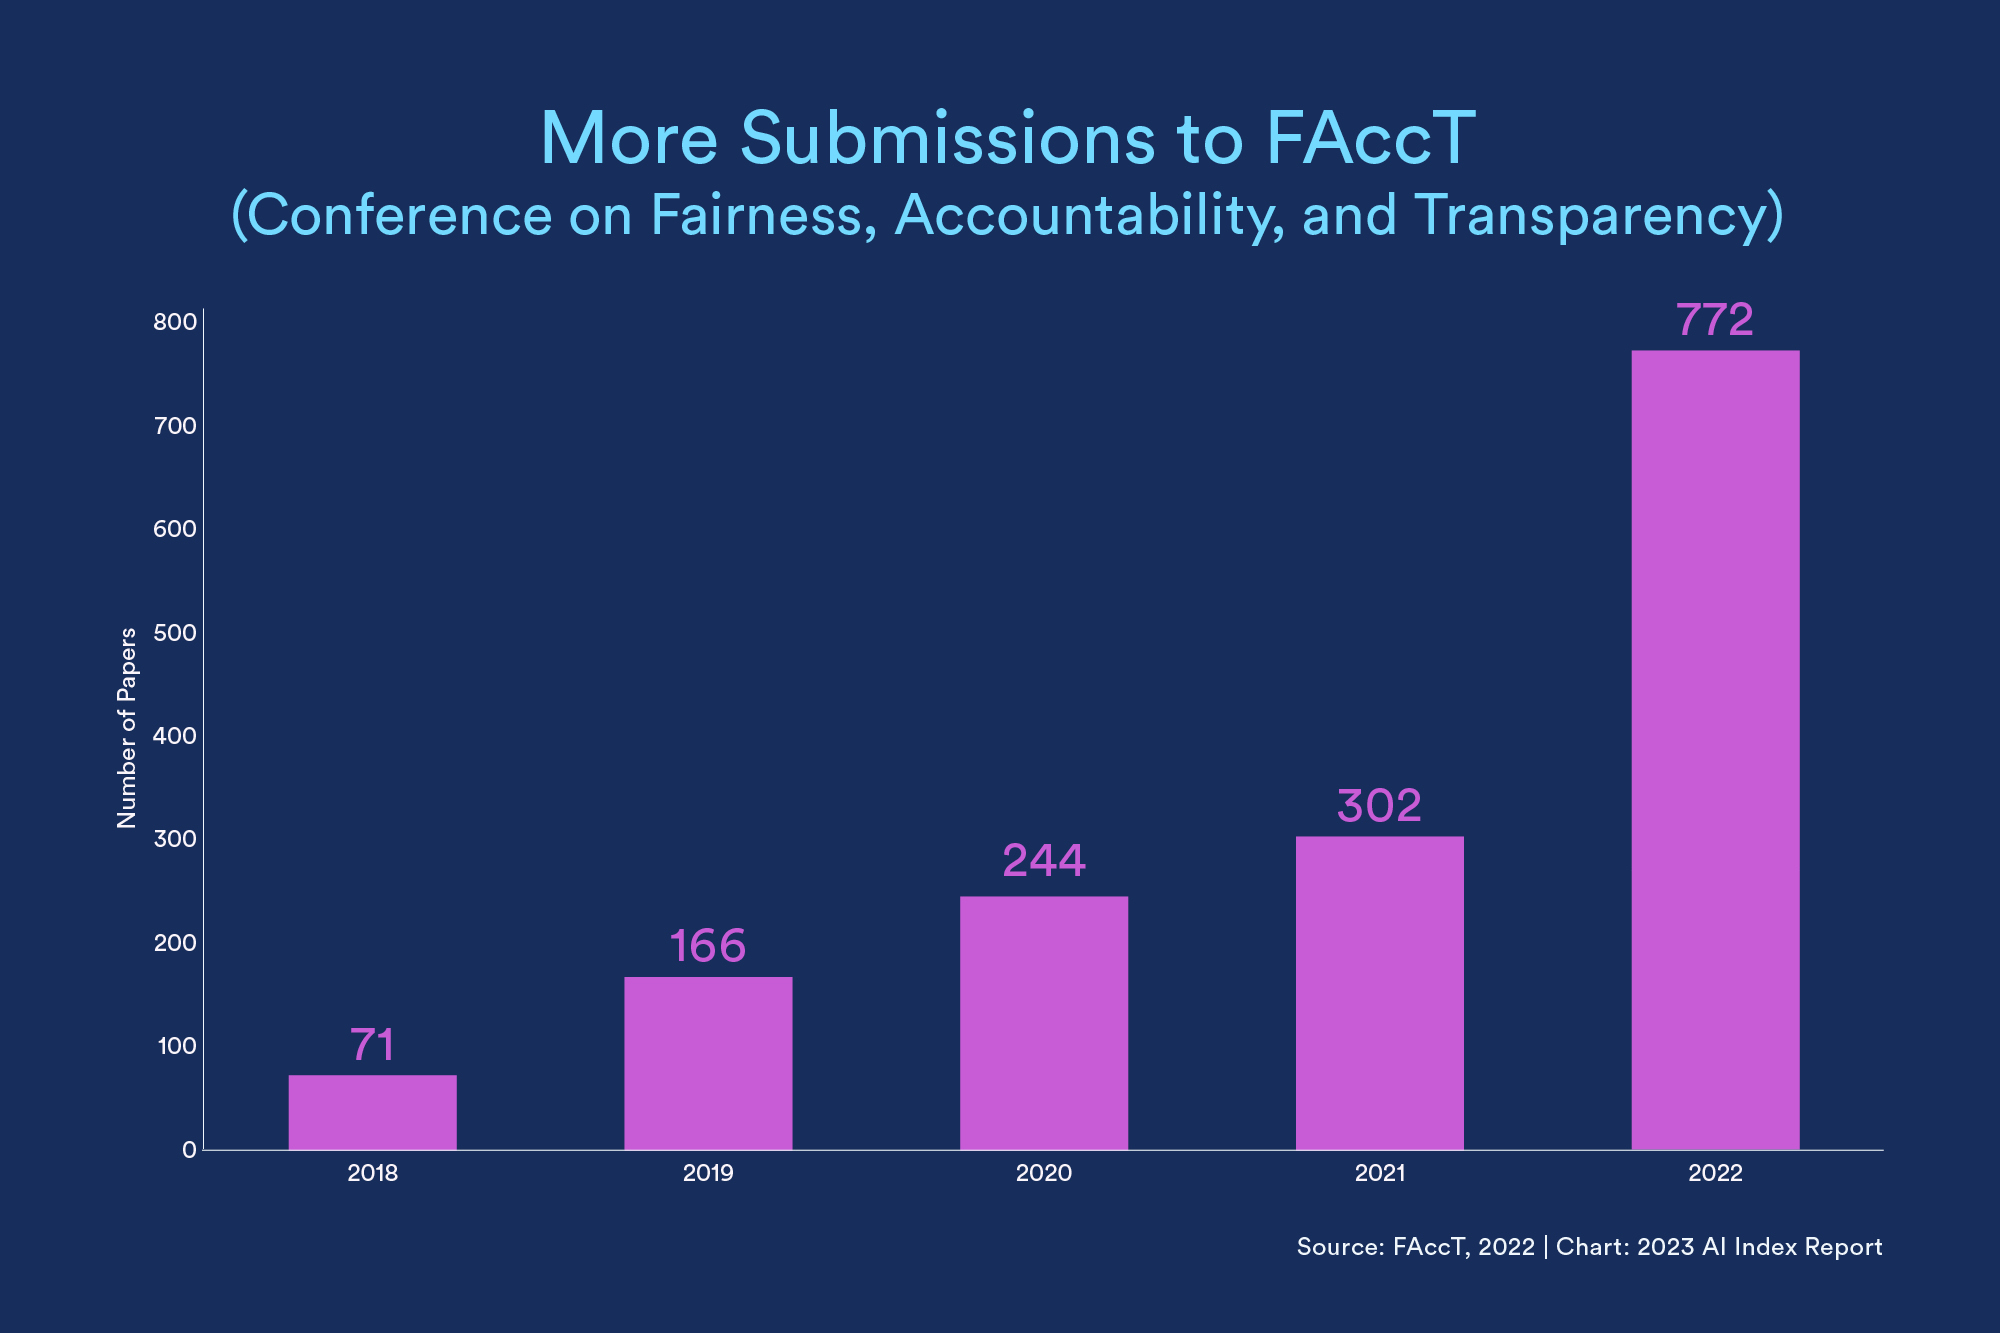
The Conference on Fairness, Accountability, and Transparency, or FAccT, saw a twofold increase in submissions from 2021 to ’22, and a 10x increase since 2018. That demonstrates increased interest in AI ethics and related work. Academic institutions dominate FAccT, but this past year, industry actors contributed more work than ever before in this space.
6: Increasing AI Labor Demand
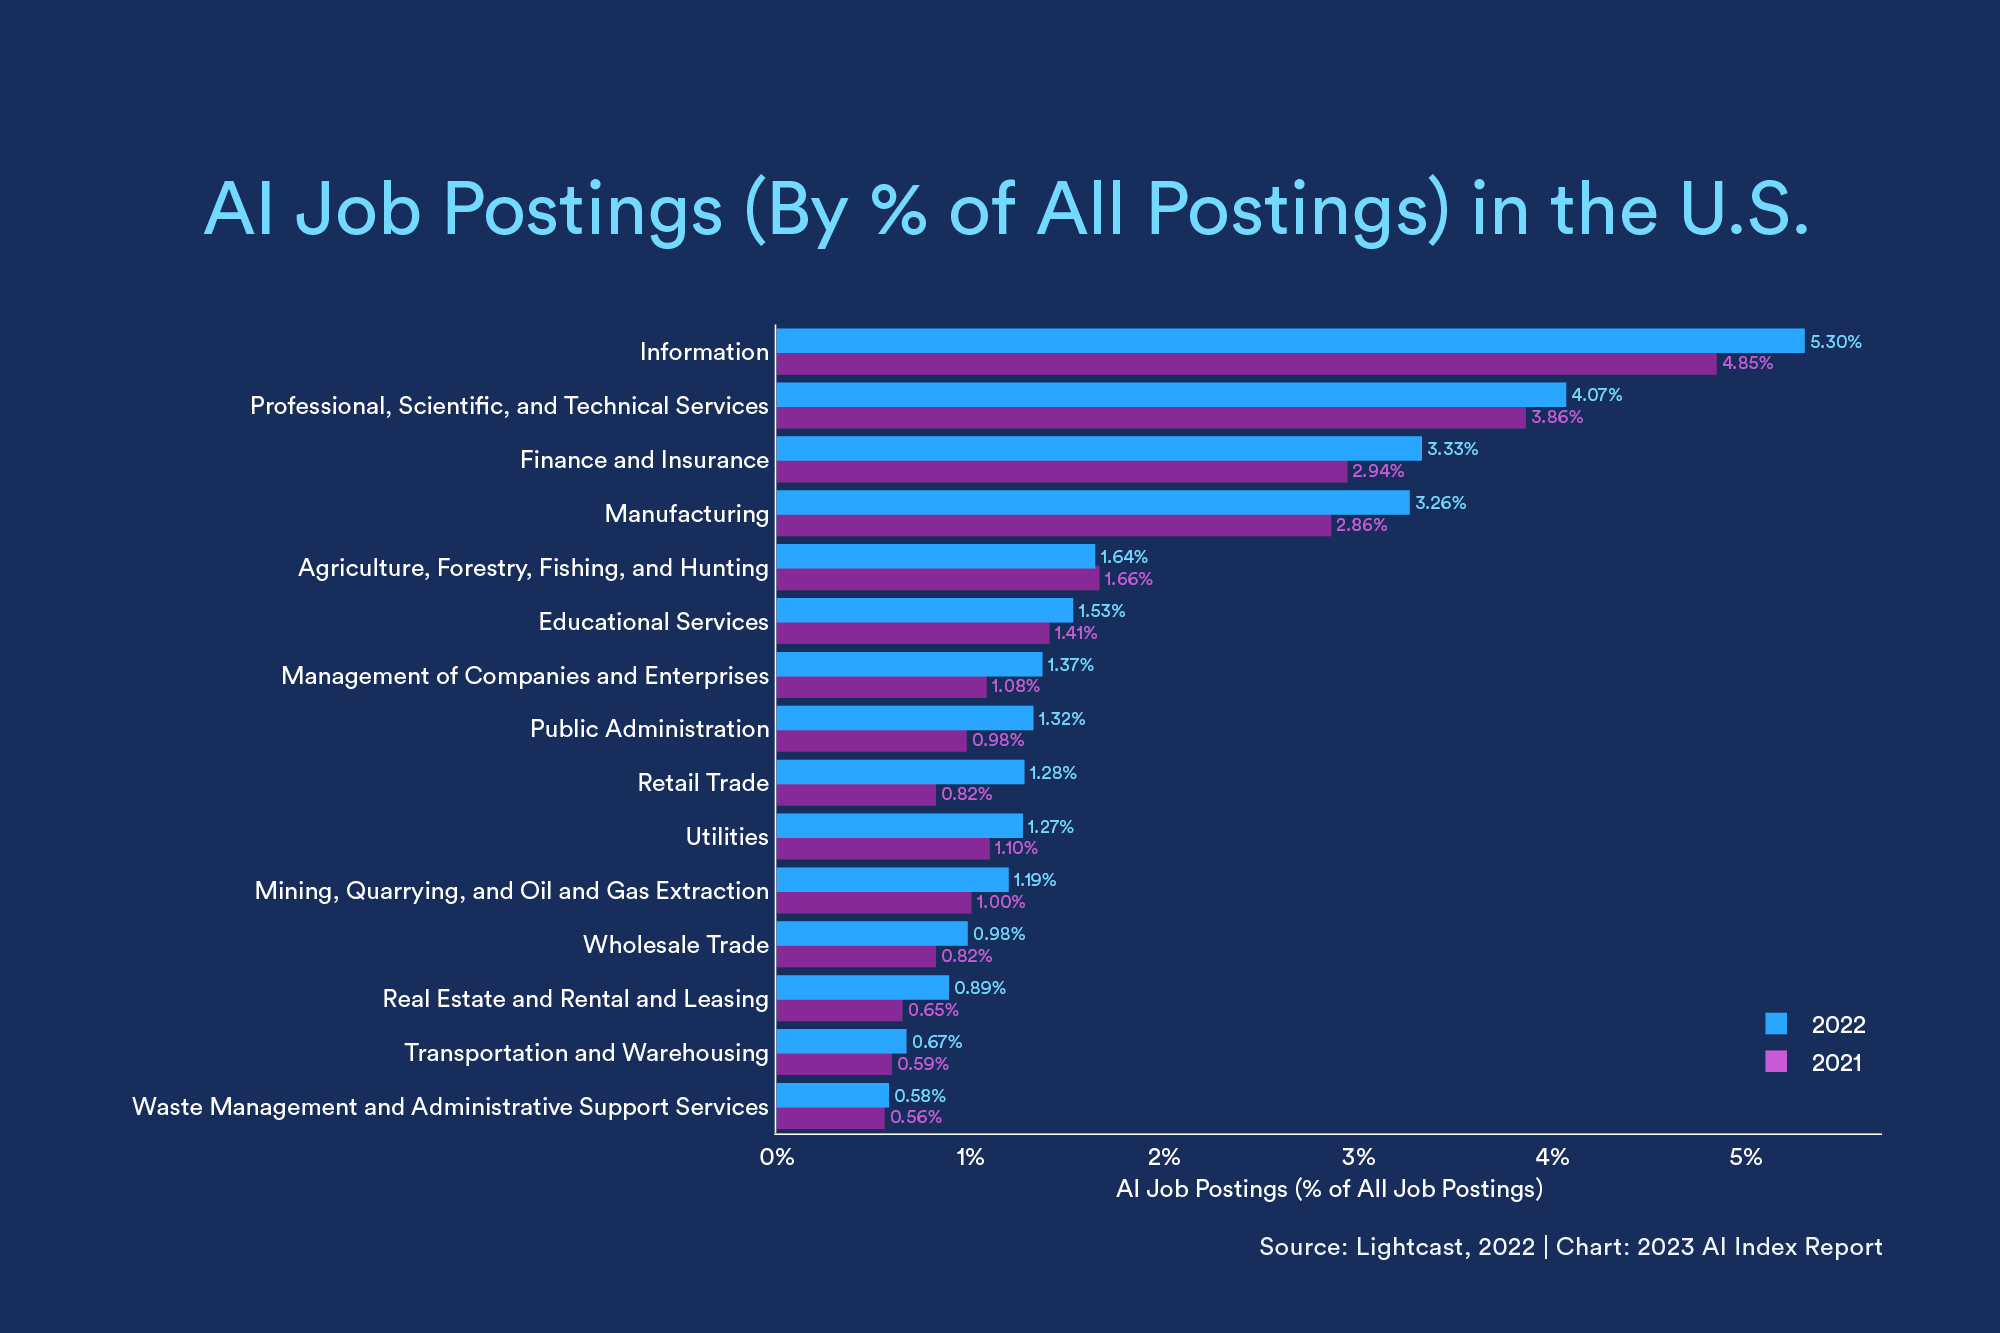
This year saw an increase in job postings seeking AI skills across all sectors, and the number of AI job postings overall were notably higher in 2022 over the prior year. The information sector dominated. California posted the most AI-related jobs by far (142,154), followed by Texas (66,624) and New York (43,899).
7: Corporate Investment Dips from 2021 Highs
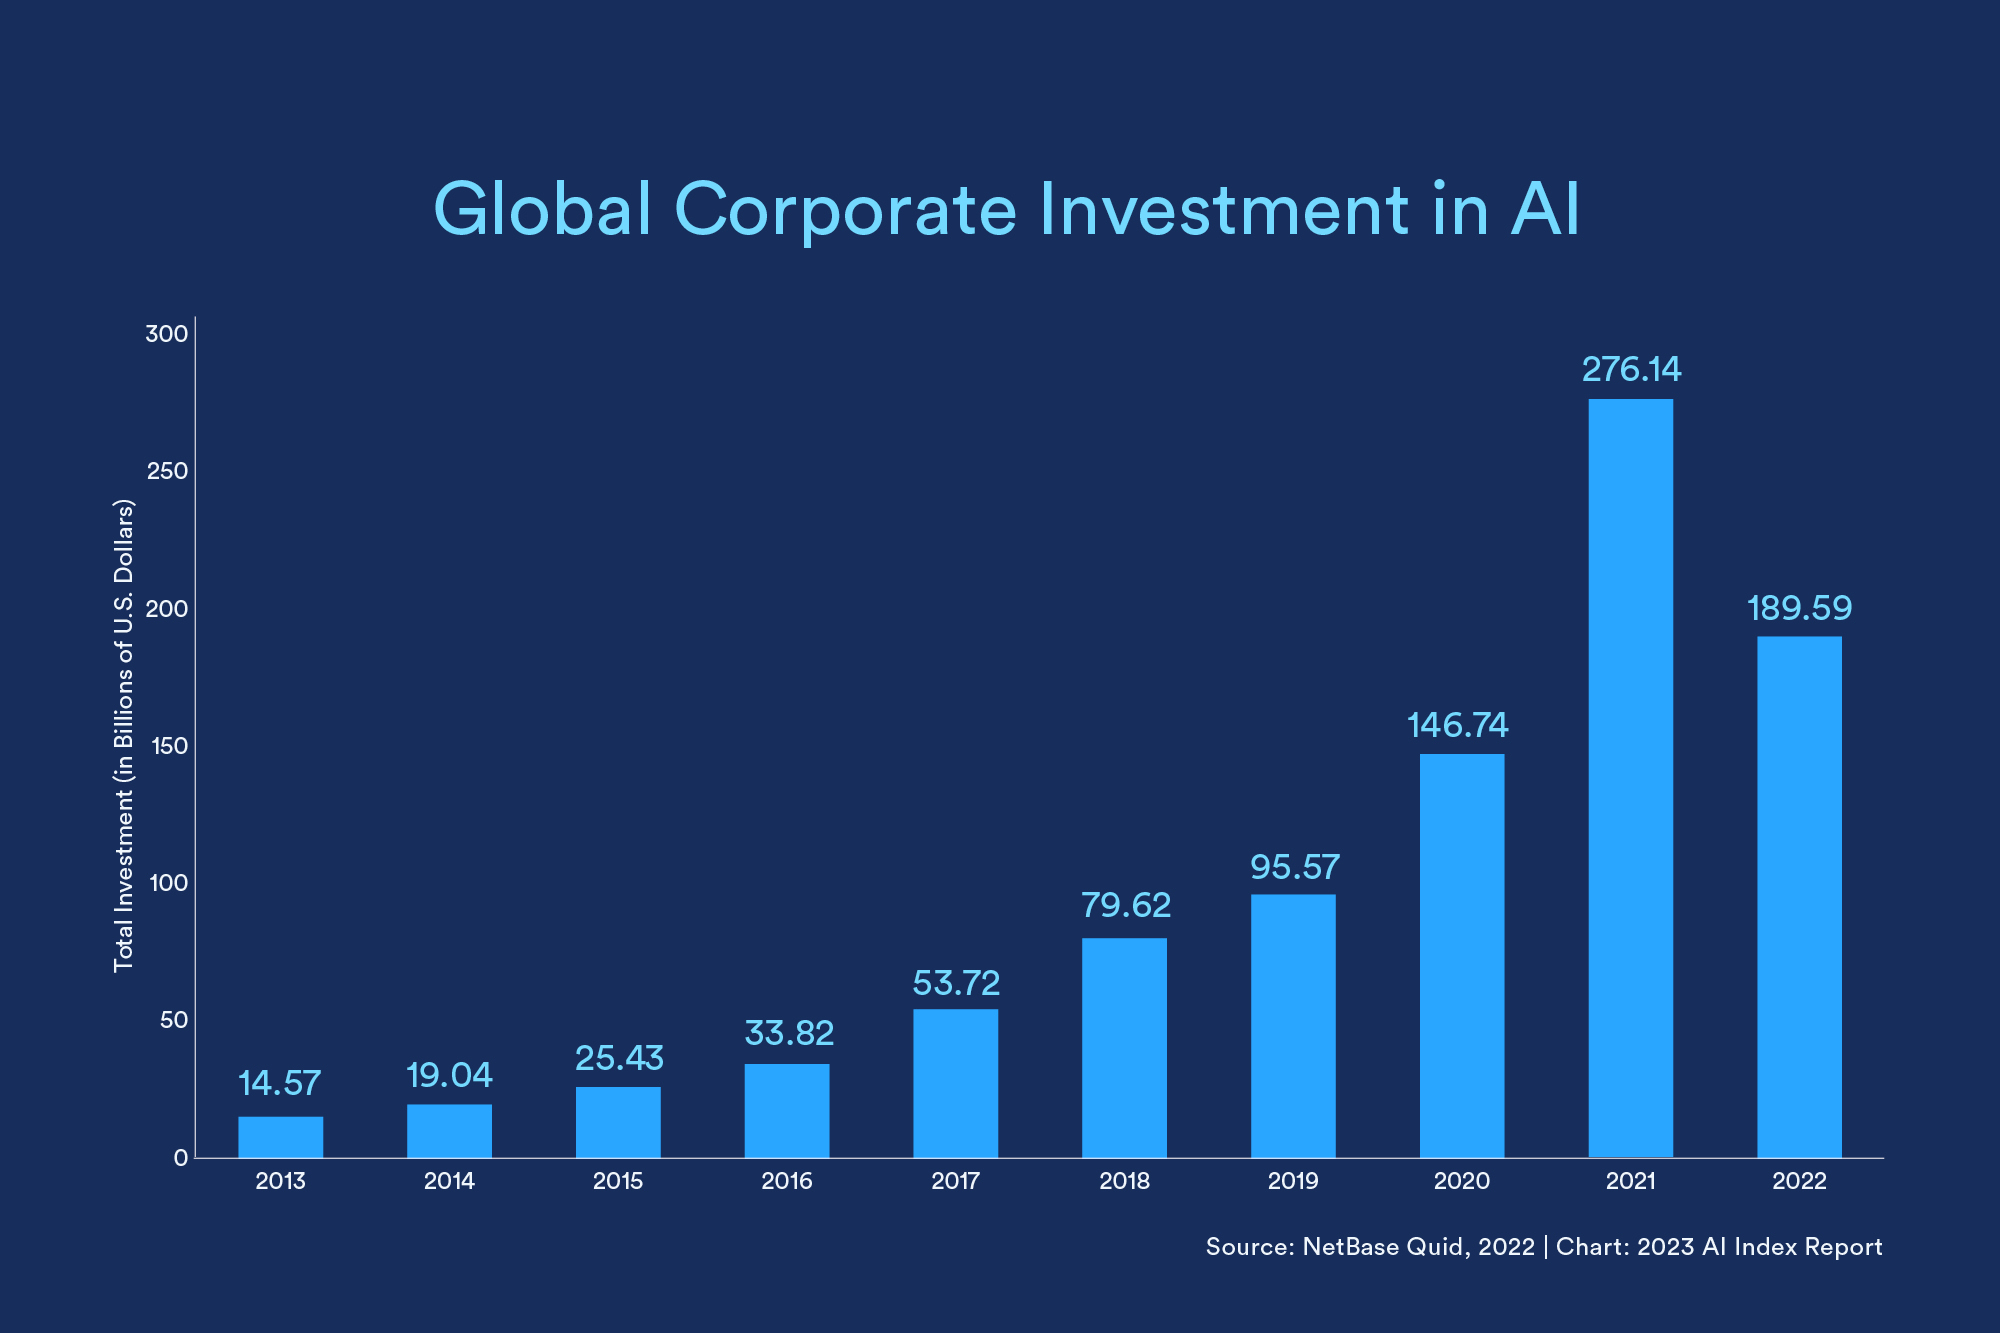
Corporate investment (mergers/acquisitions, minority stakes, private investment, and public offerings) dipped in 2022 from 2021 highs, but the number has still increased 13-fold in the last decade. The biggest investment event of the year was the Nuance Communications acquisition; the computer software tech company was picked up by Microsoft for $19.7 billion.
8: China's Robot Rush
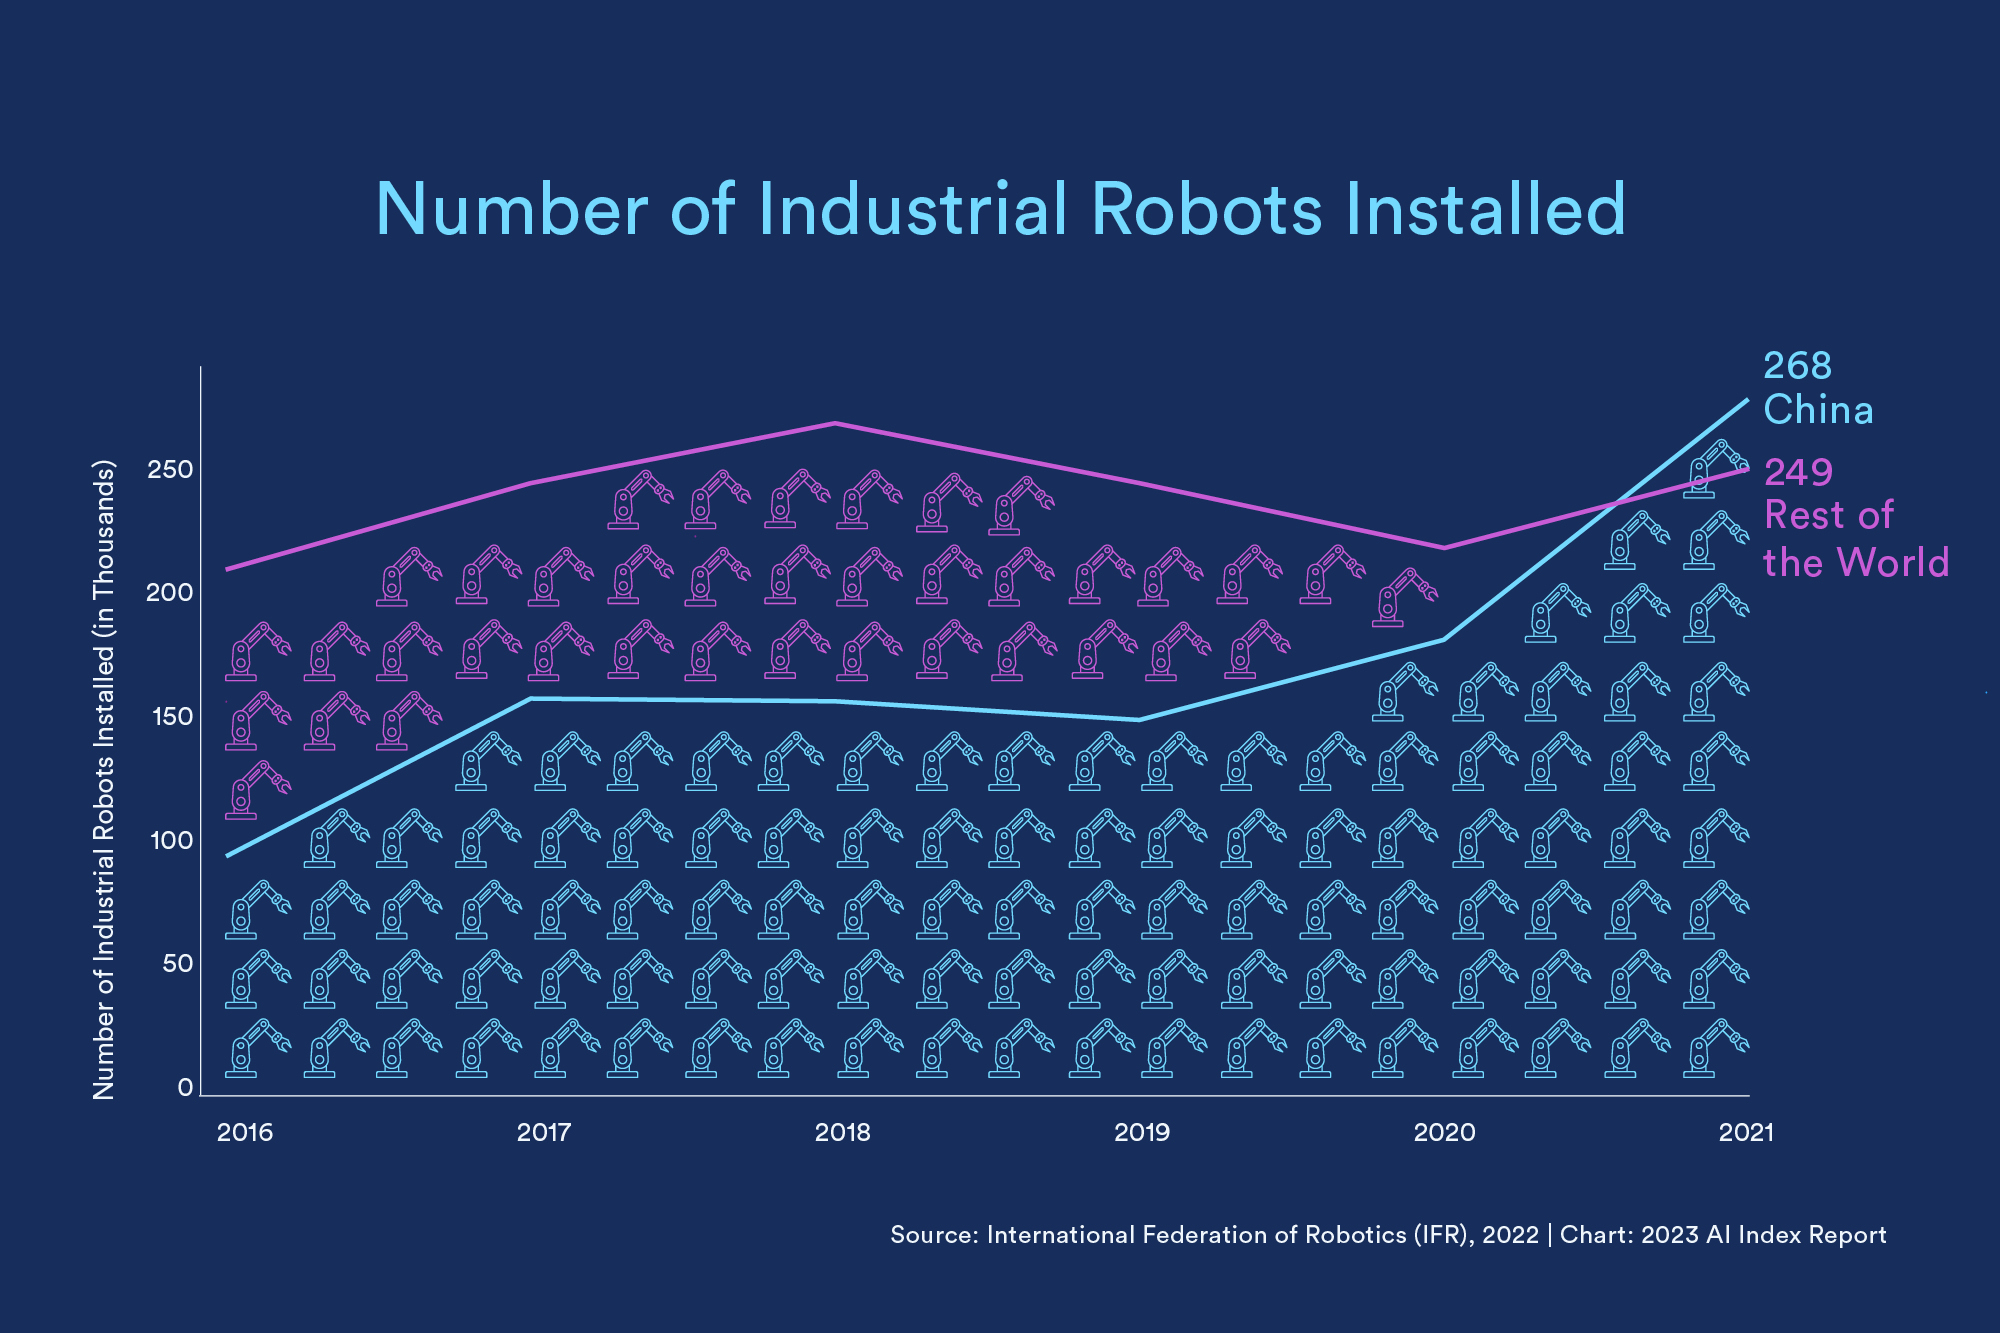
Robotic installations are up 31% around the world, but no country prioritized integration of robots quite like China. In 2013, China overtook Japan as the nation installing the most industrial robots, and since then, that gap has only widened. In 2021, China installed more of these robots than the rest of the world combined, and today, the country represents 51.8% of all industrial robotic installations.
9: Industry Draws Talent, Government Lags
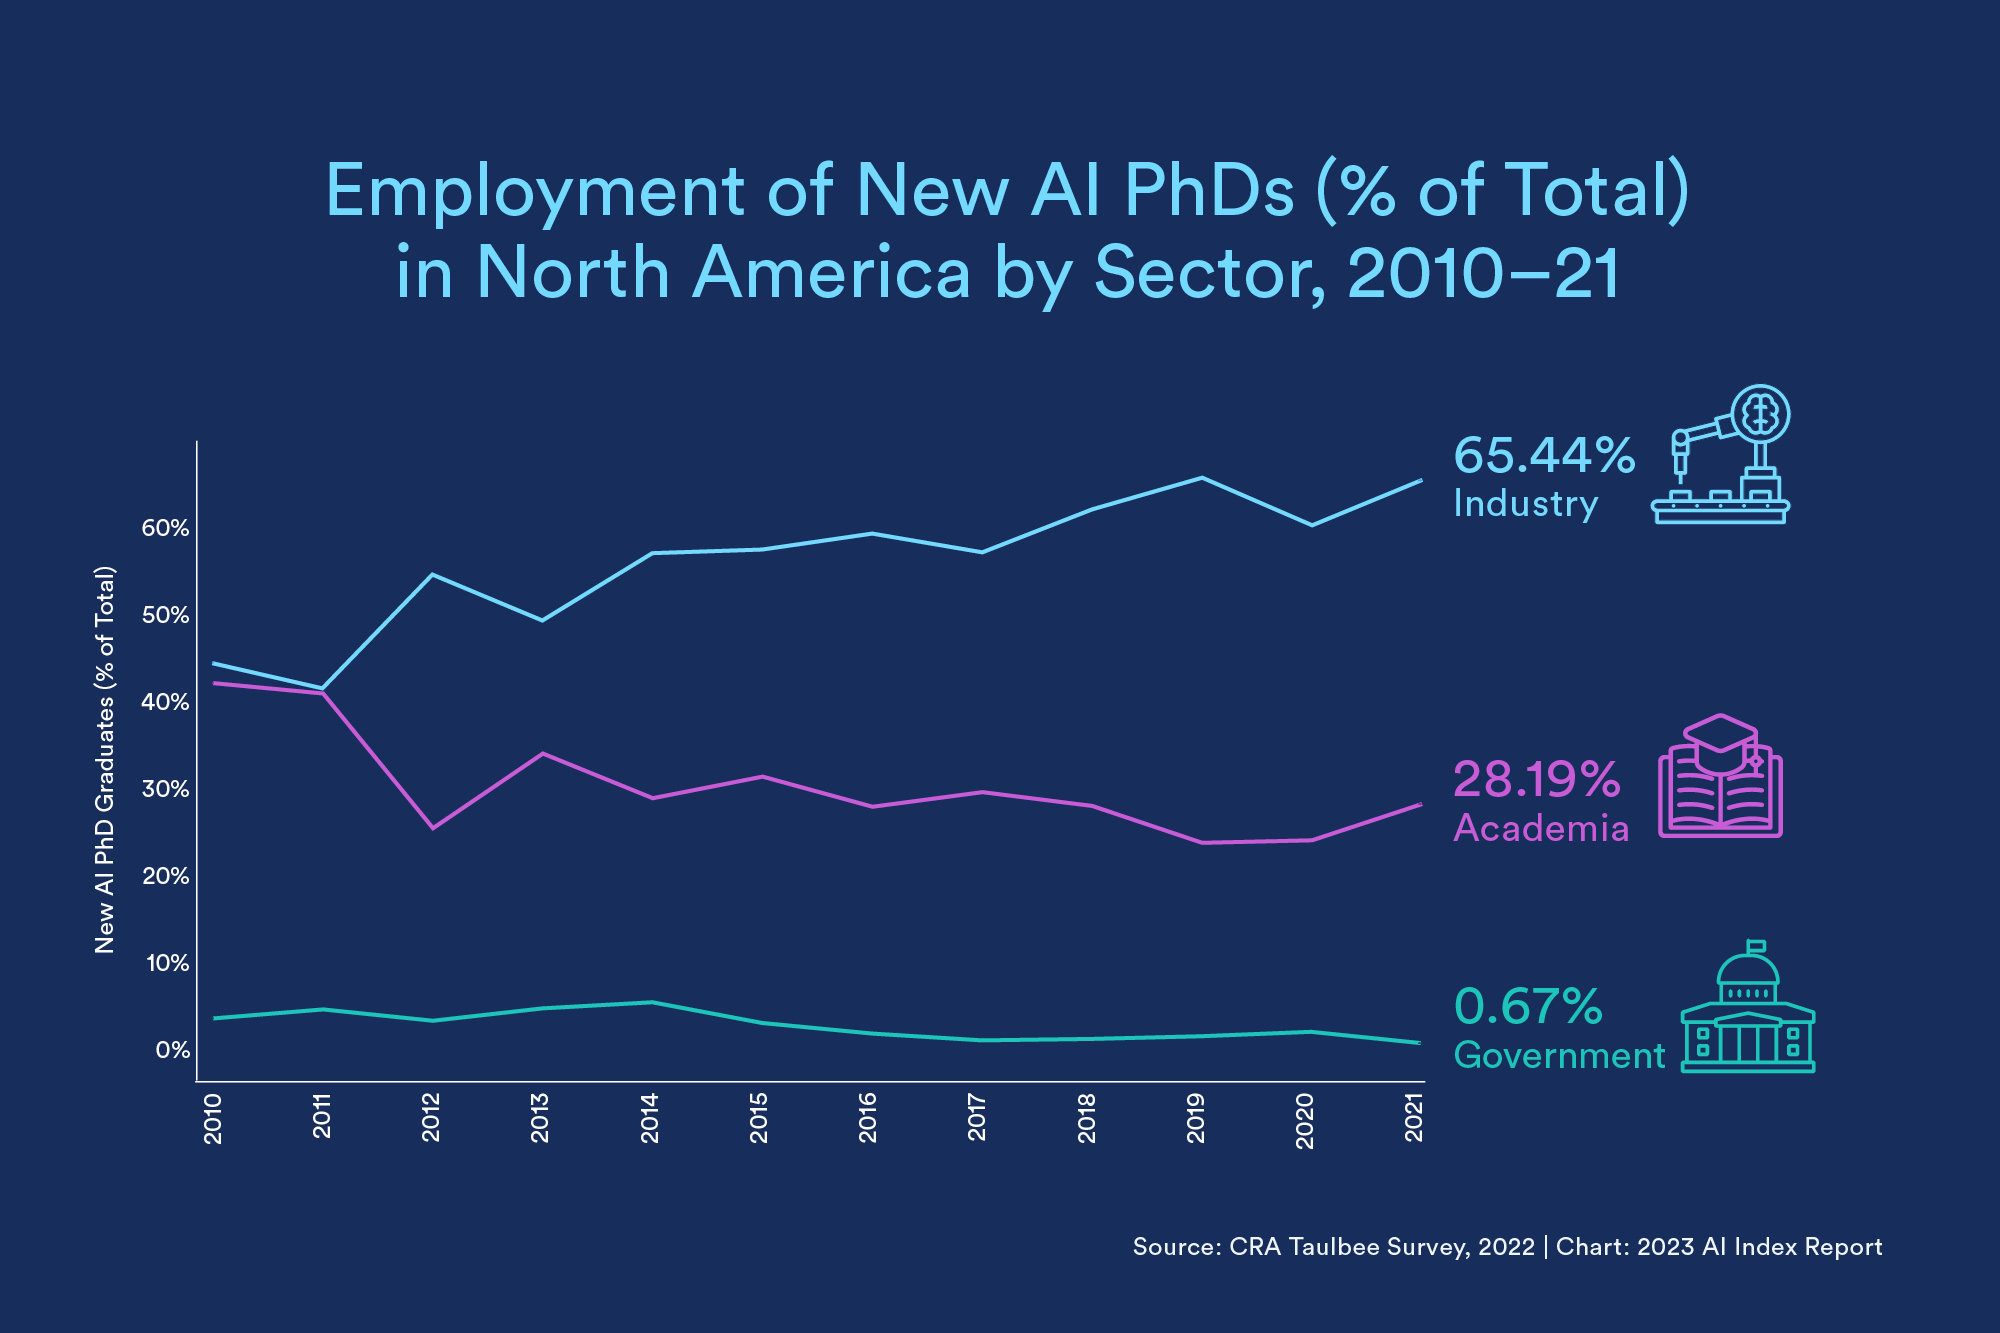
When newly minted AI PhDs leave school, most head into industry jobs. The amount of new PhDs entering government is a scant 0.7%, relatively unchanged in the last half-decade.
10: More Countries Pass AI-Related Legislation
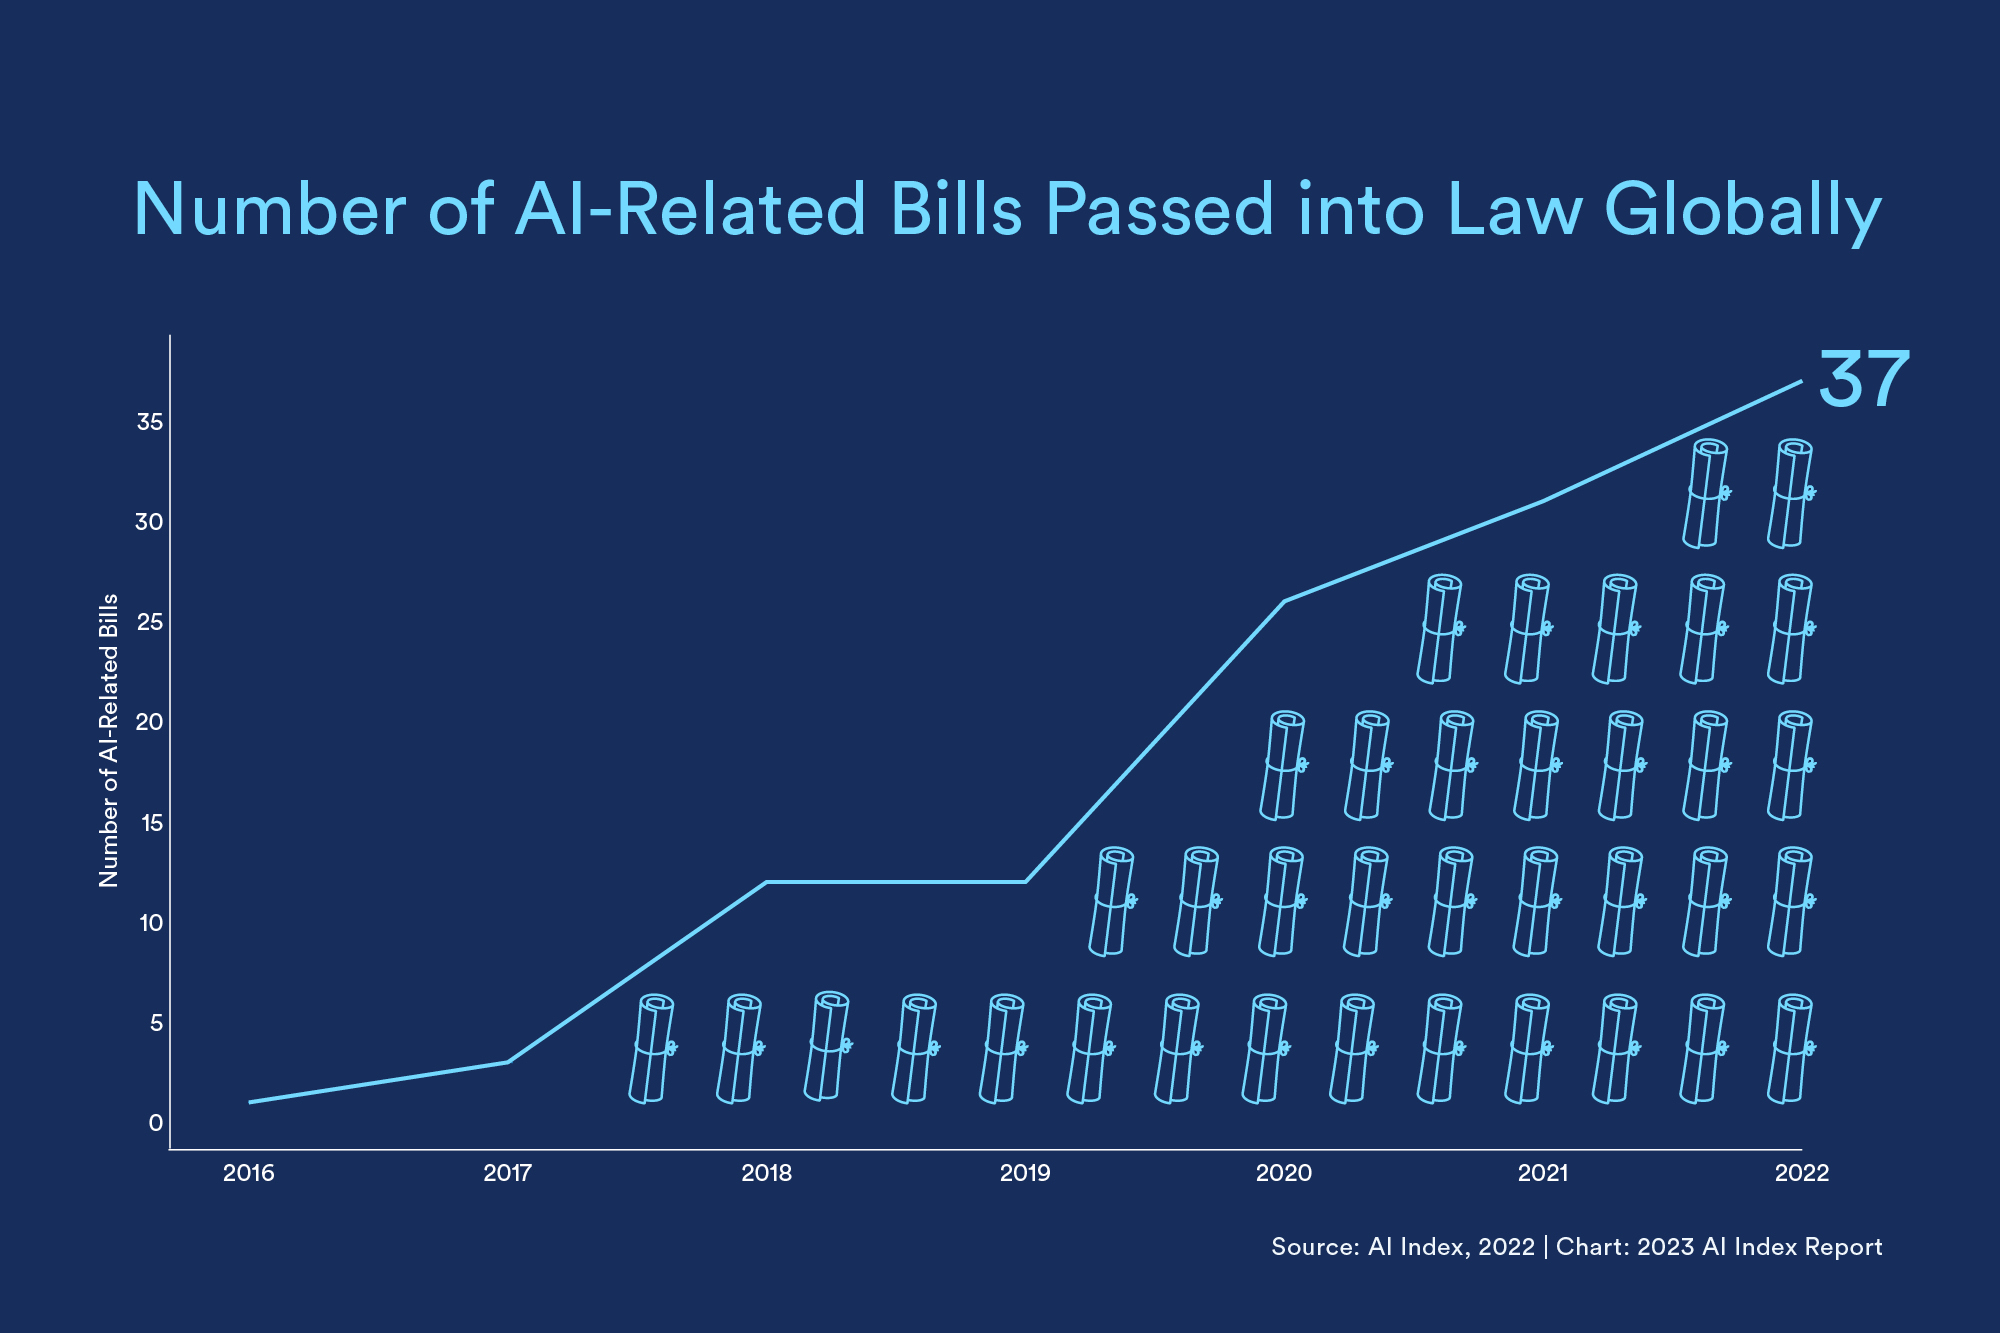
Legislative bodies in 127 countries passed 37 laws that included the words “artificial intelligence” this past year. The U.S. led the list, passing nine laws, followed by Spain (5) and the Philippines (4). Bills included one in the Philippines discussing education reforms to meet challenges caused by new technologies including AI, a Spanish bill focused on nondiscrimination and accountability in AI algorithms, and an act establishing an AI training program through the U.S. Office of Management and Budget. Since 2016, countries have passed 123 AI-related bills, the majority in recent years.
11: U.S. Federal Budget for AI Ticks Up
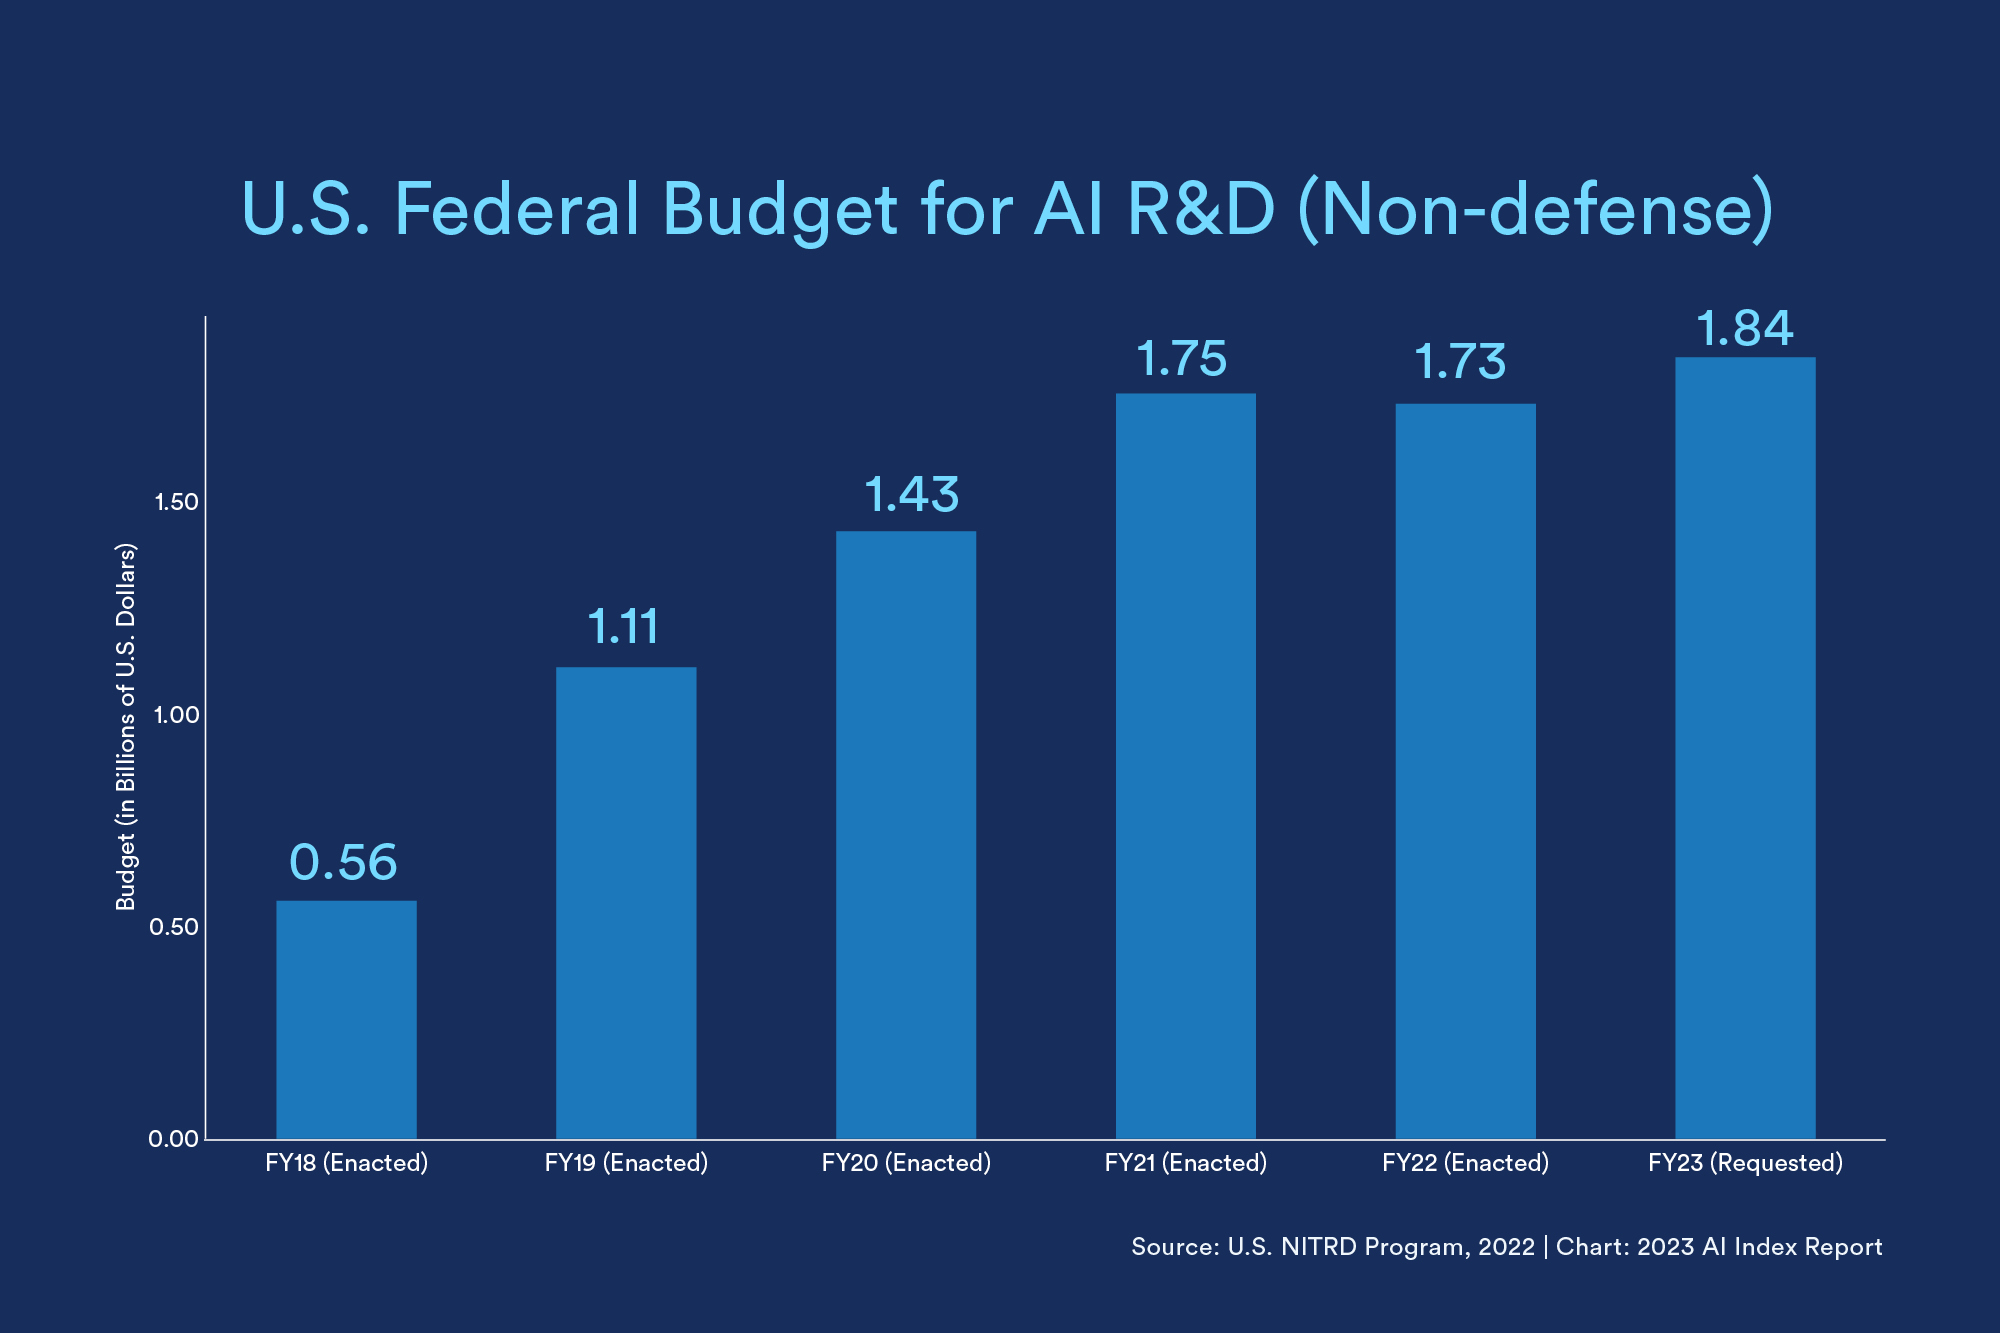
The U.S. government continues to shift dollars into AI research and development. In fiscal year 2022, U.S. government agencies allocated $1.7 billion to AI R&D, up 13% from the year prior and an increase of 209% from 2018. Meanwhile, the Department of Defense, in its nonclassified AI budget request, asked for $1.1 billion, a 26% increase from the prior year.
12: More Women Graduate with Computer Science Degrees
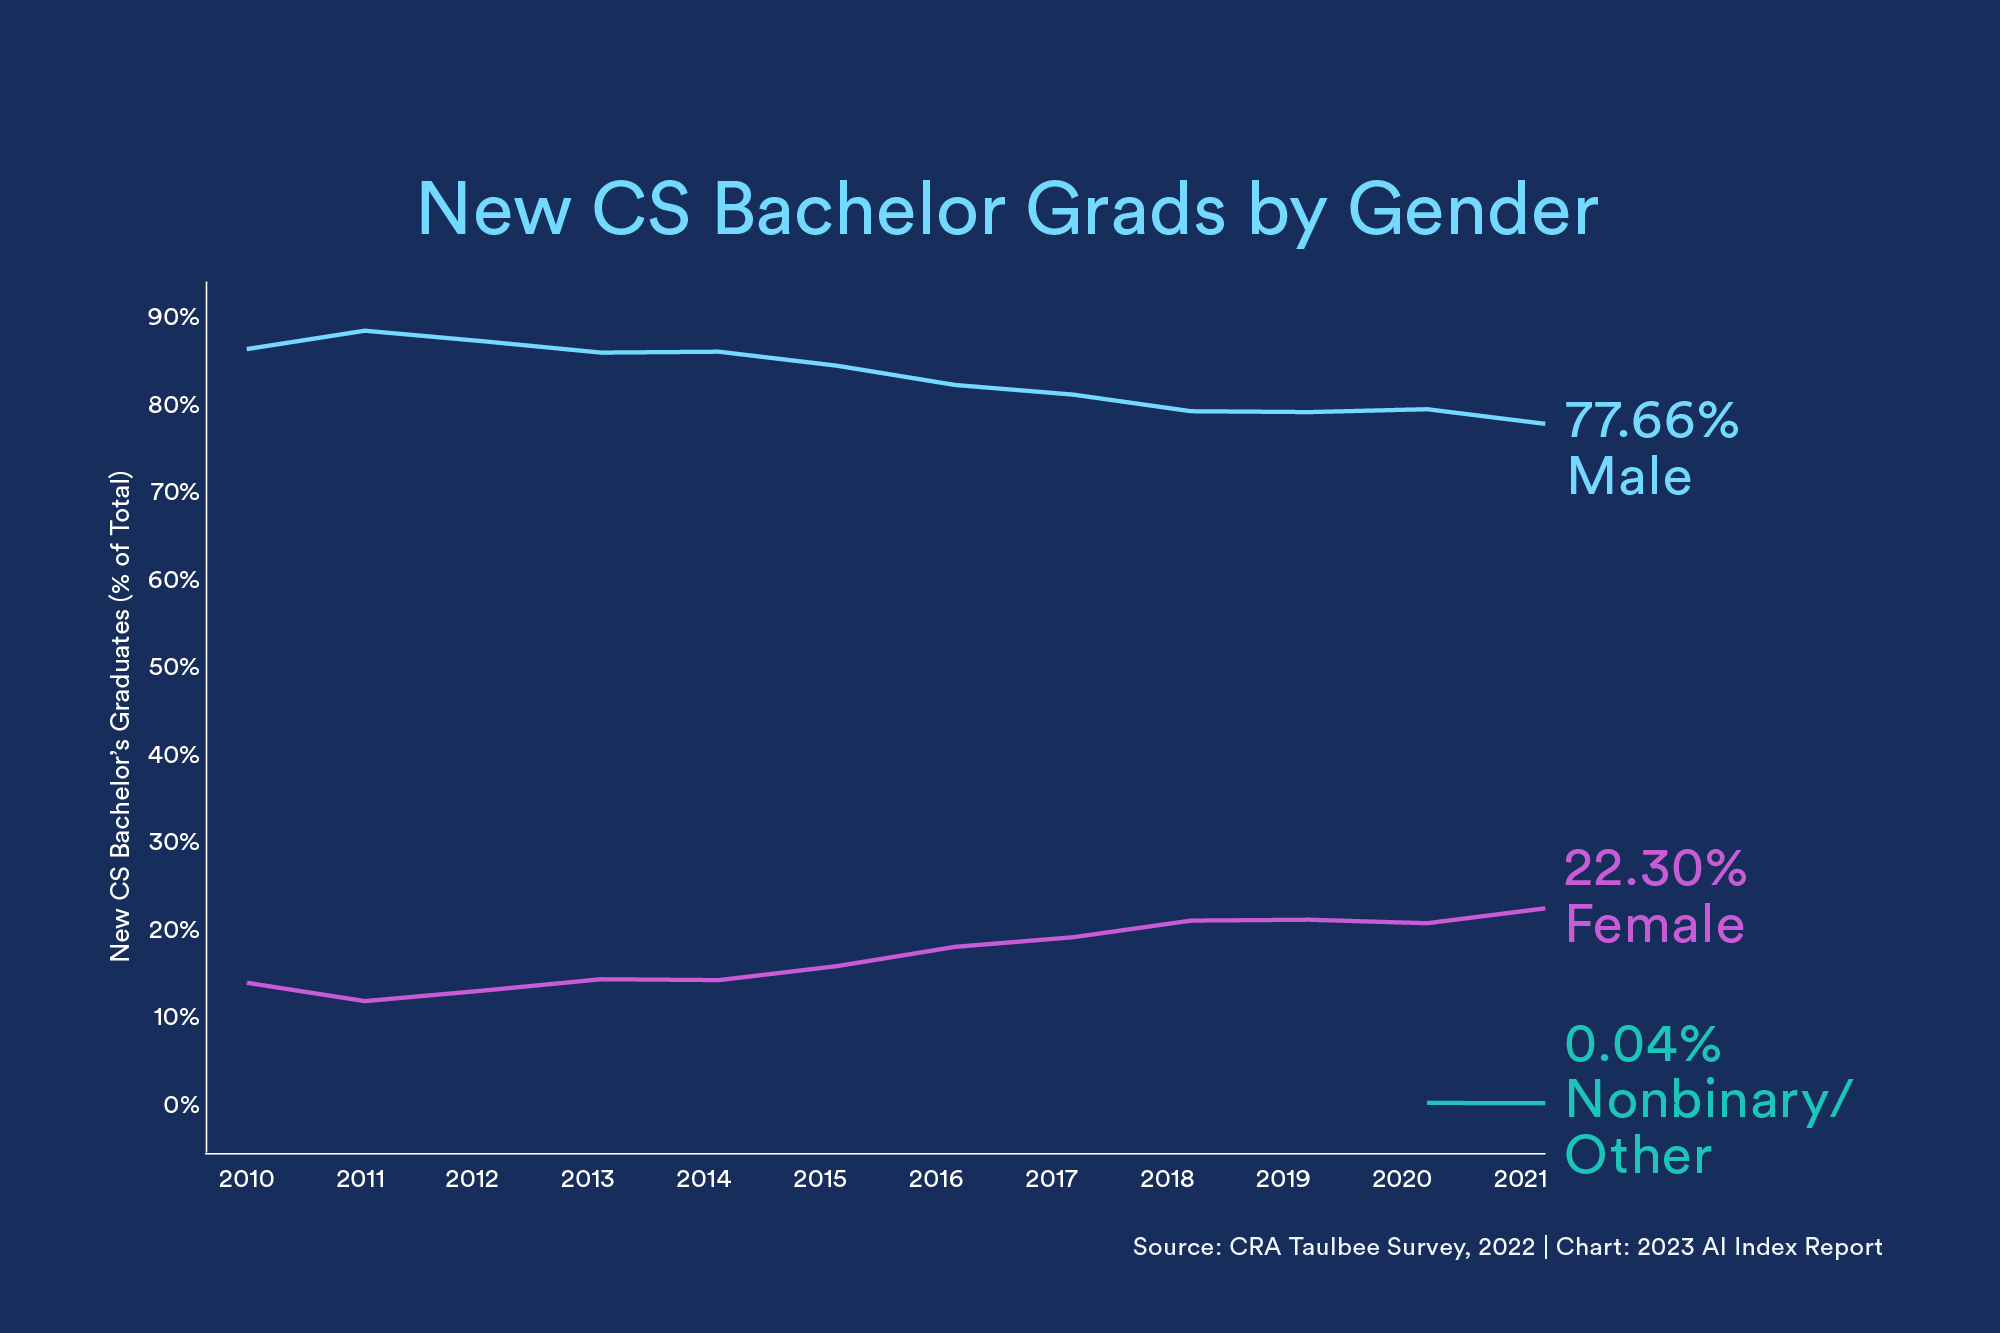
Although AI (and STEM fields more broadly) continues to struggle with diversity, more women are entering the field. The percentage of women among CS bachelor’s degree graduates rose to 22.3%, continuing a broader trend in the past decade.
13: And Broader Ethnic Diversity as Well
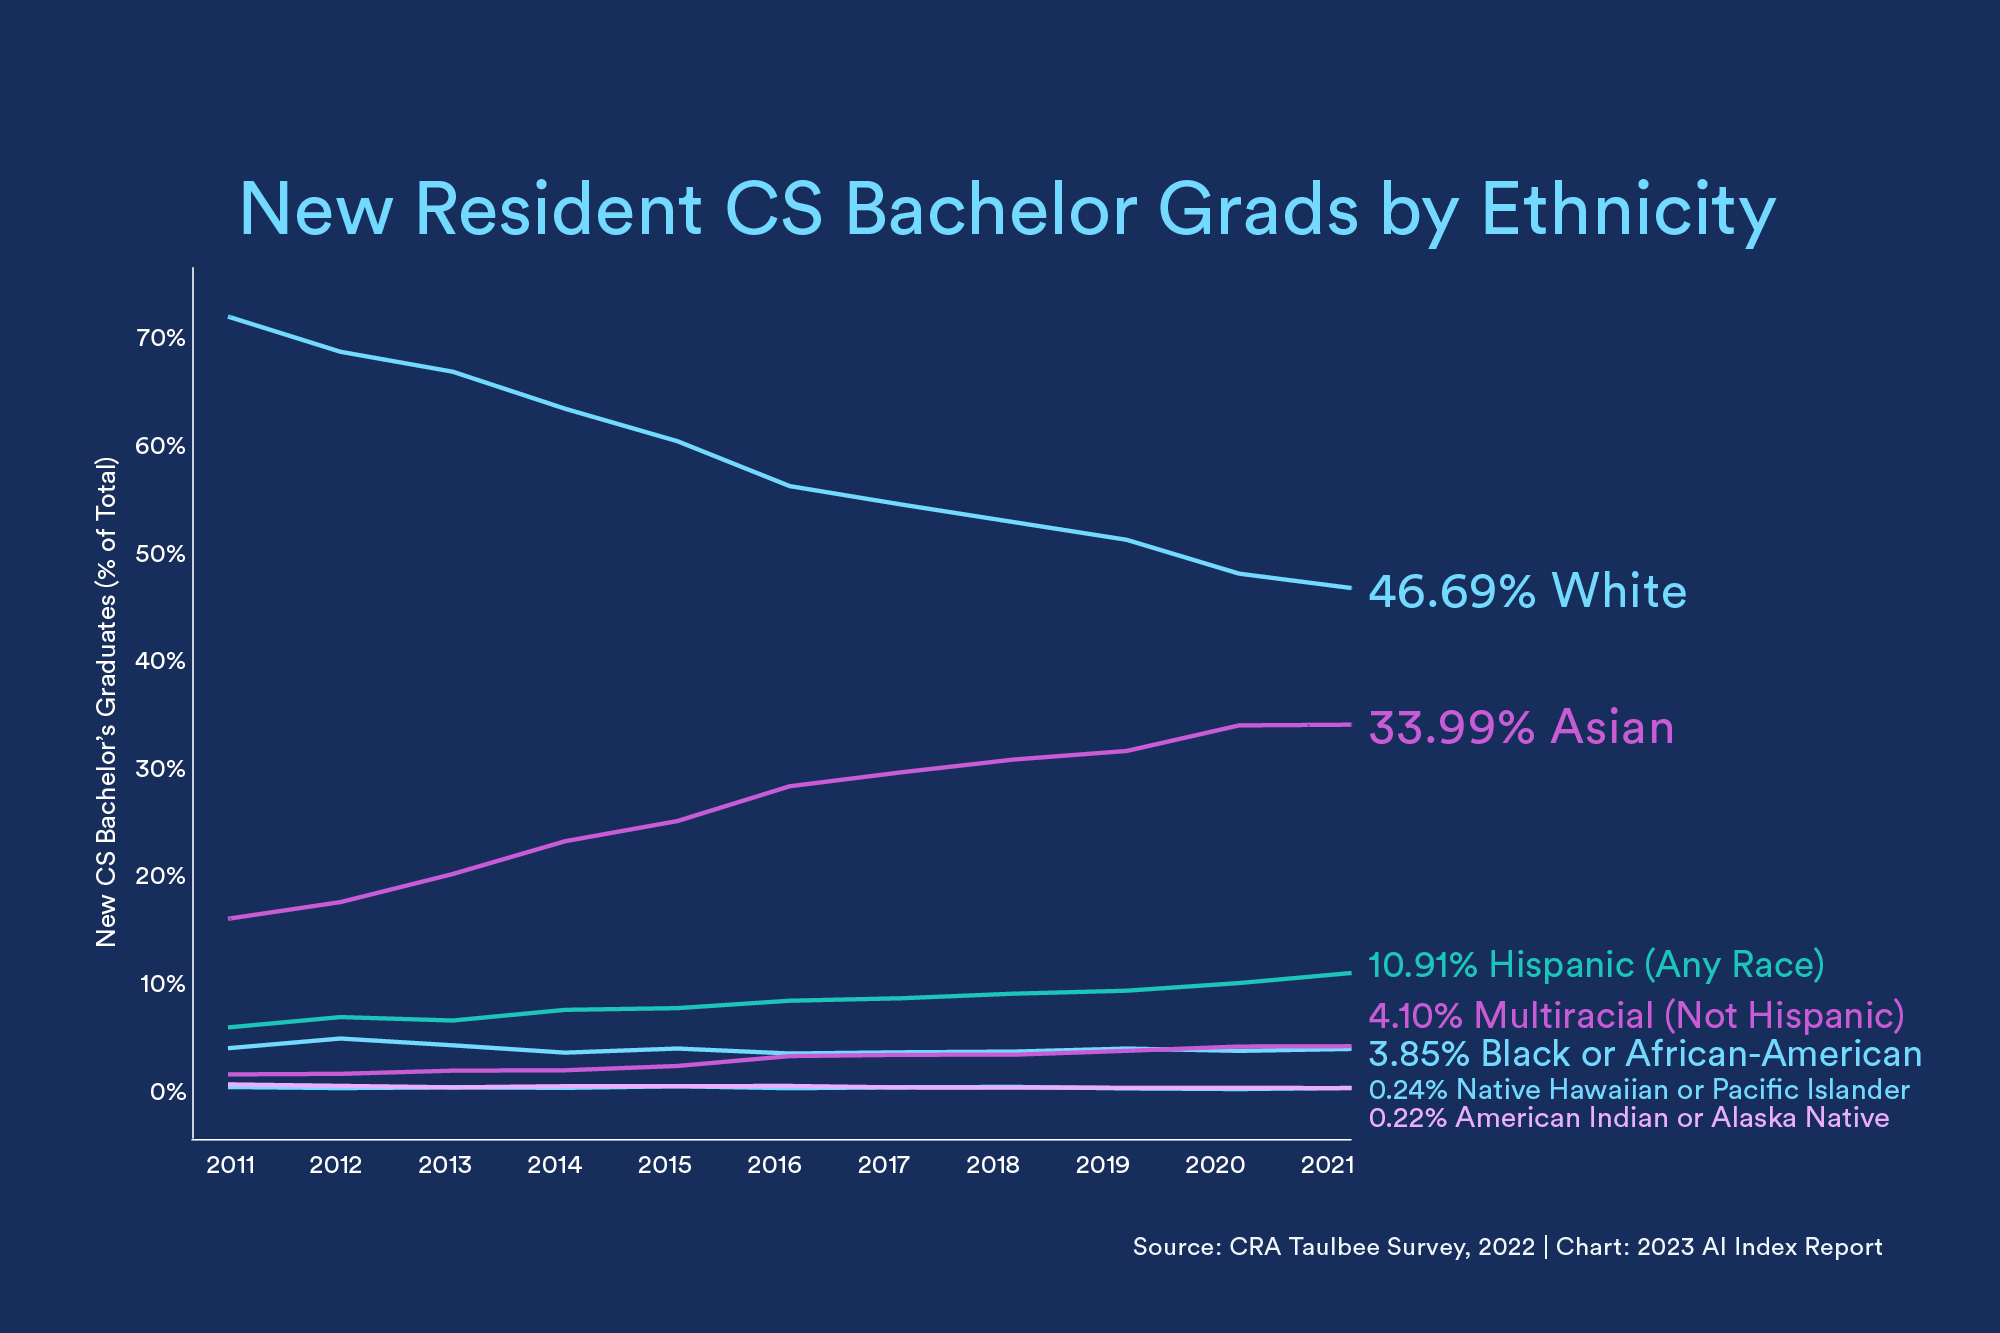
Meanwhile, CS bachelors are growing more ethnically diverse. While white students still make up the majority of new grads, the proportion of new graduates who are Asian, Hispanic, or multiracial has steadily increased over the past decade.
14: More Women Faculty
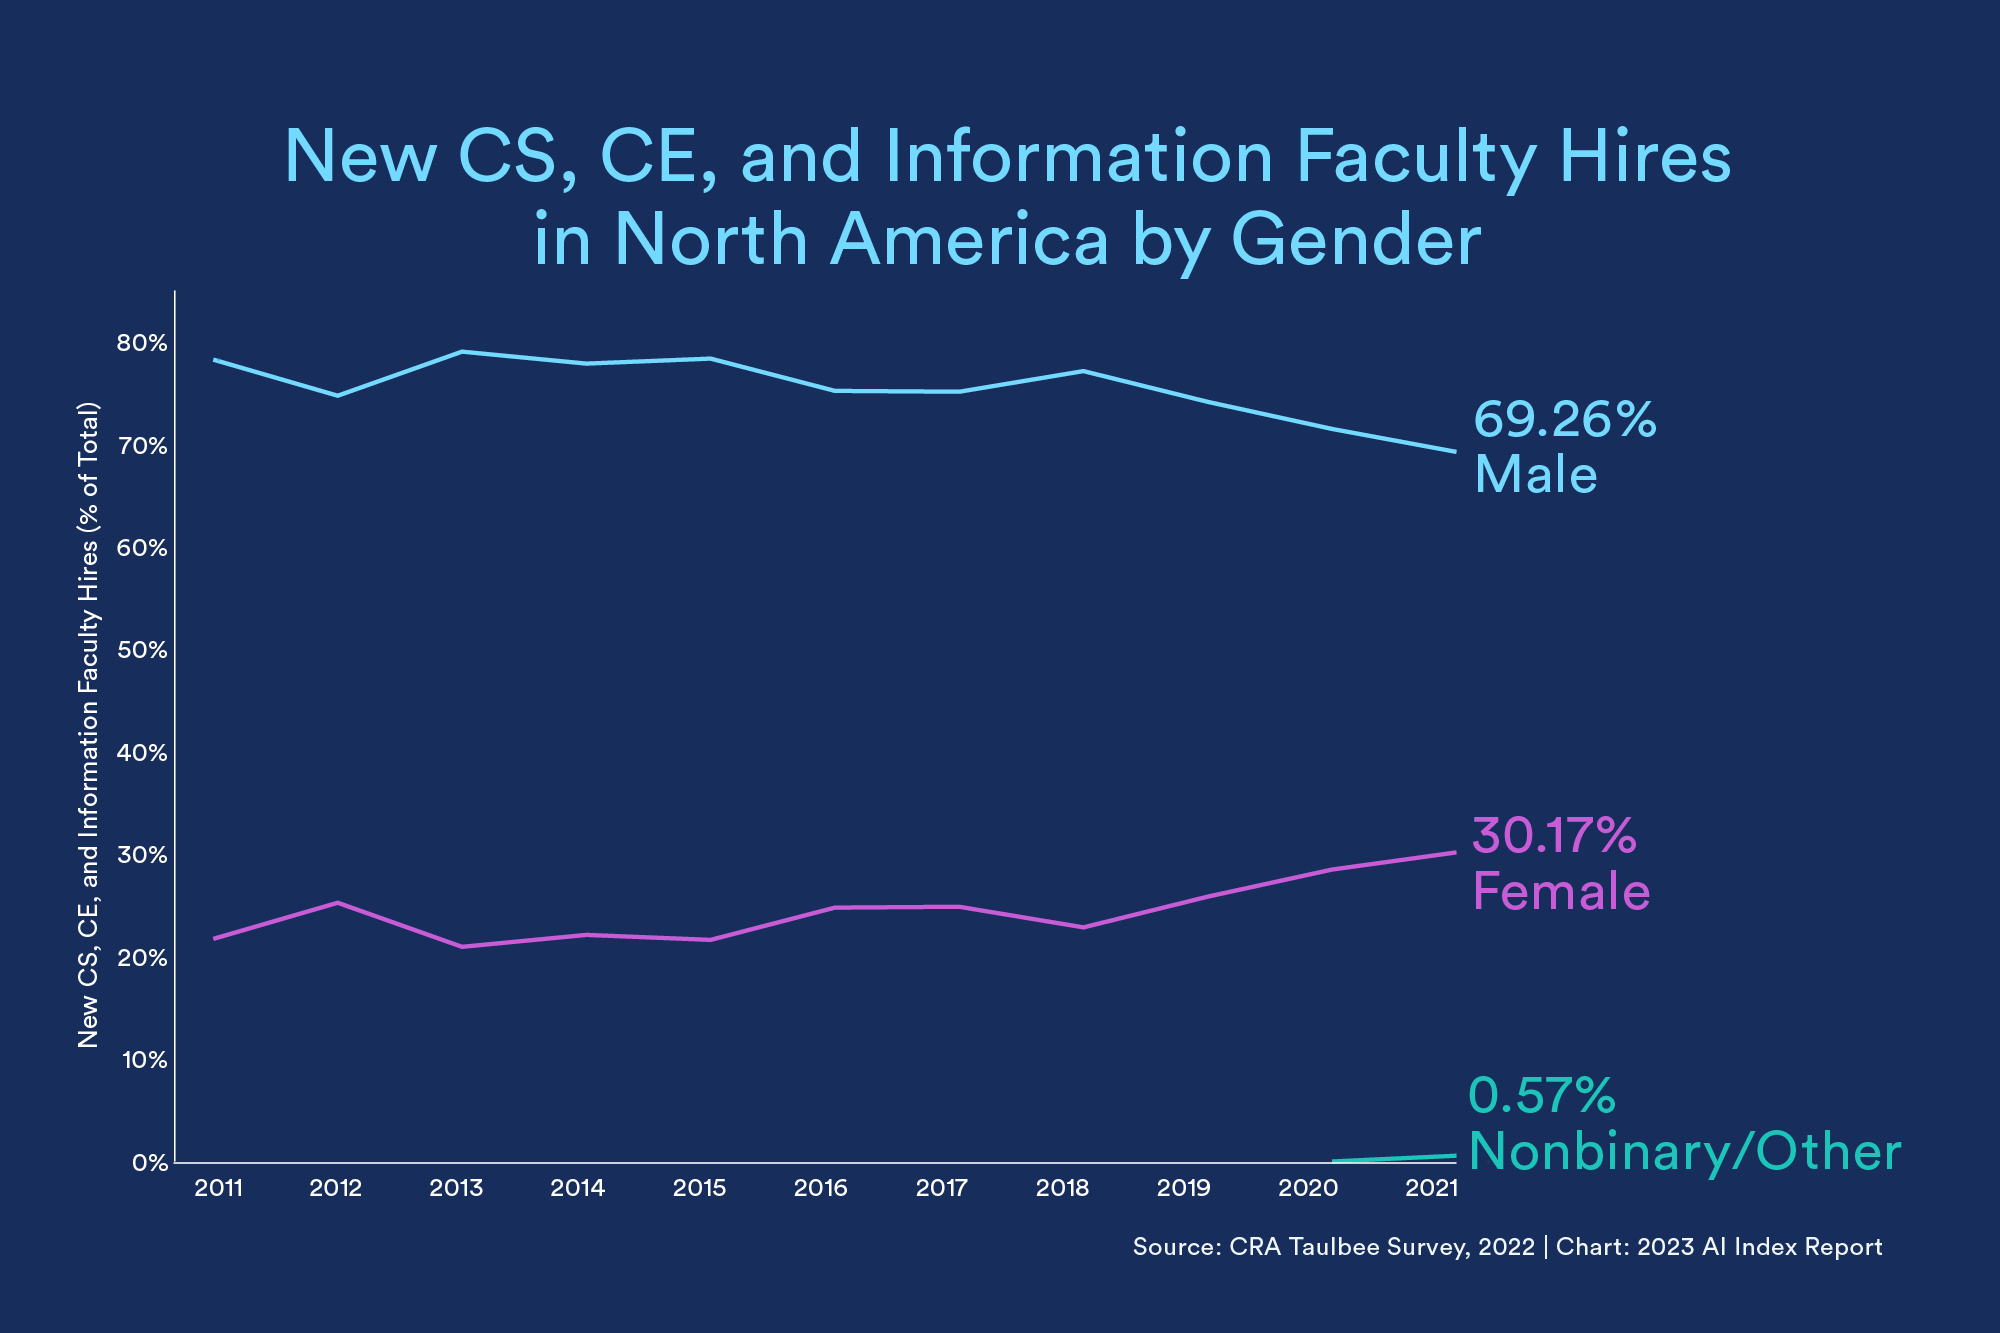
And in another positive trend, more women are getting hired as CS, CE, and information faculty. Although the faculty of North American universities still skews heavily male, the proportion who are women has now reached a new high of 30.2%, up about 8.5% from 2015.
Dive deeper into these trends and more in the new report. Visit the AI Index.
Stanford HAI’s mission is to advance AI research, education, policy and practice to improve the human condition. Learn more.