Introduction to spatial data analysis
Geographic data is used everywhere. From ordering food online to understanding where food grows, from looking up the weather for today, to analyzing climate risks in the future, a lot of data is geographically located.
Geographic data is used everywhere. From ordering food online to understanding where food grows, from looking up the weather for today, to analyzing climate risks in the future, a lot of data is geographically located. In fact, some estimates suggest as much as 80% of big data could be geographic. In this blog, we will learn to use and analyze geographic data with the following objectives in mind:
Expected learning outcomes:
We will learn how to visualize a spatial point dataset on a map
We will analyze the spatial correlation using a variogram
We will learn how to interpolate the missing spatial data
We will learn how to estimate the uncertainty of interpolated spatial data
Because data can be mapped based on any reference (e.g., surface of Earth, or corners of a room), we will use the term "spatial data" instead of geographic data henceforth. But think of spatial data as the same thing: any measurement which is associated with a location.
Examples of spatial datasets
Let's first take a look at different real-world spatial datasets:
Social Science: Safety alert map of San Francisco Bay Area
Credit: Citizen, Date: 01/12/2022
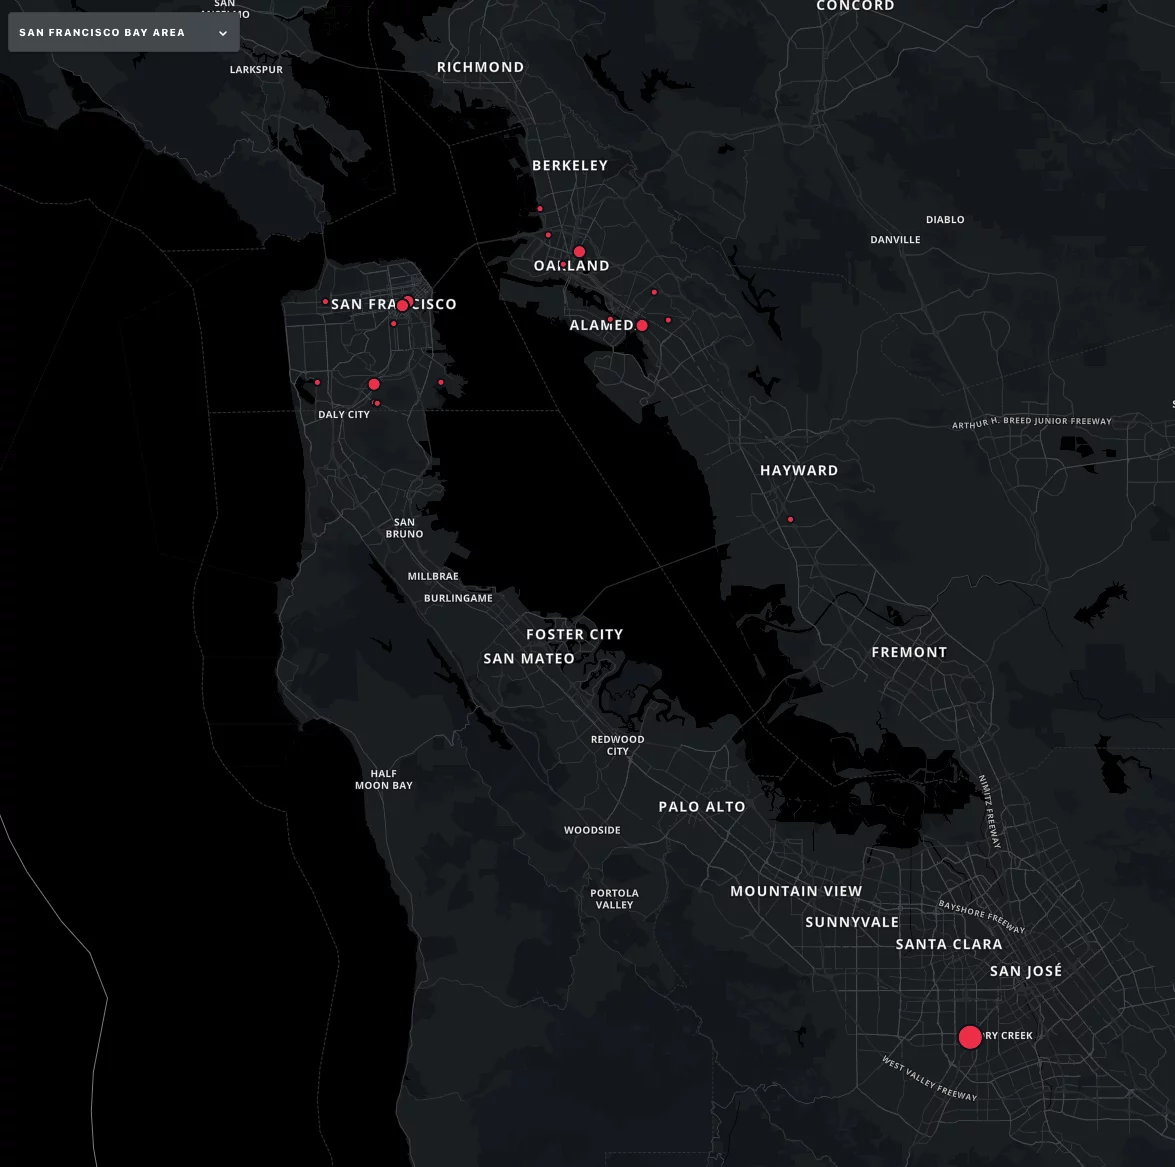 This is a safety alert map of the San Francisco Bay Area from the Citizen app. Each incident is labeled with geo-referenced coordinates. The radius indicates the severeness of that event.
This example shows us one common type of spatial data: point data. Point data is not associated with any spatial resolution. Each data point just represents one event or one measurement.
Epidemiology: Covid-19 Hospitalization map of the U.S.
Credit: The New York Times, Date: 01/12/2022
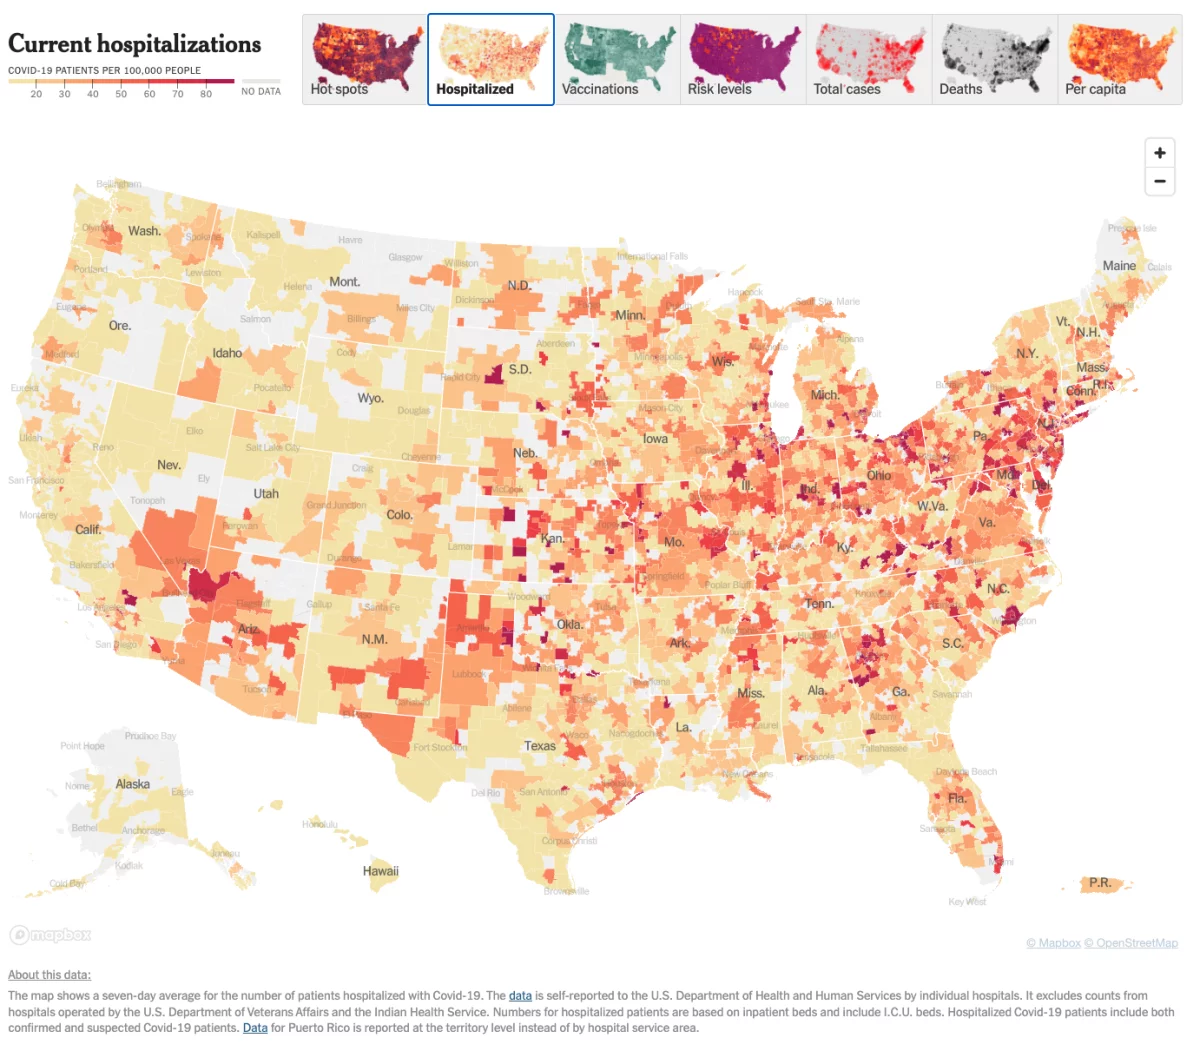 Another example is the COVID hospitalization map. The color of each county indicates how many patients have been hospitalized per 100,000 people. Instead of being a point-wise dataset, now the spatial data is represented by polygons, where we take some average within one polygon. Then the spatial resolution of each data is determined by the area of each county.
We do see some gray polygons with no data because some counties do not share the hospitalization rate publicly. In spatial data analysis, we often have this missing data problem. Therefore, we want to know if we can do some interpolations to fill in those missing locations.
For example, if we want to interpolate the missing data in one county of Oregon and in one county of Ohio, can we guess which one has a higher hospitalization rate? Possibly Ohio, right? Because the available counties in Ohio have higher hospitalization rates than in Oregon. This can be quantitively termed as spatial correlation. We will see a hands-on example of this in the next section.
Earth science: Groundwater level in California
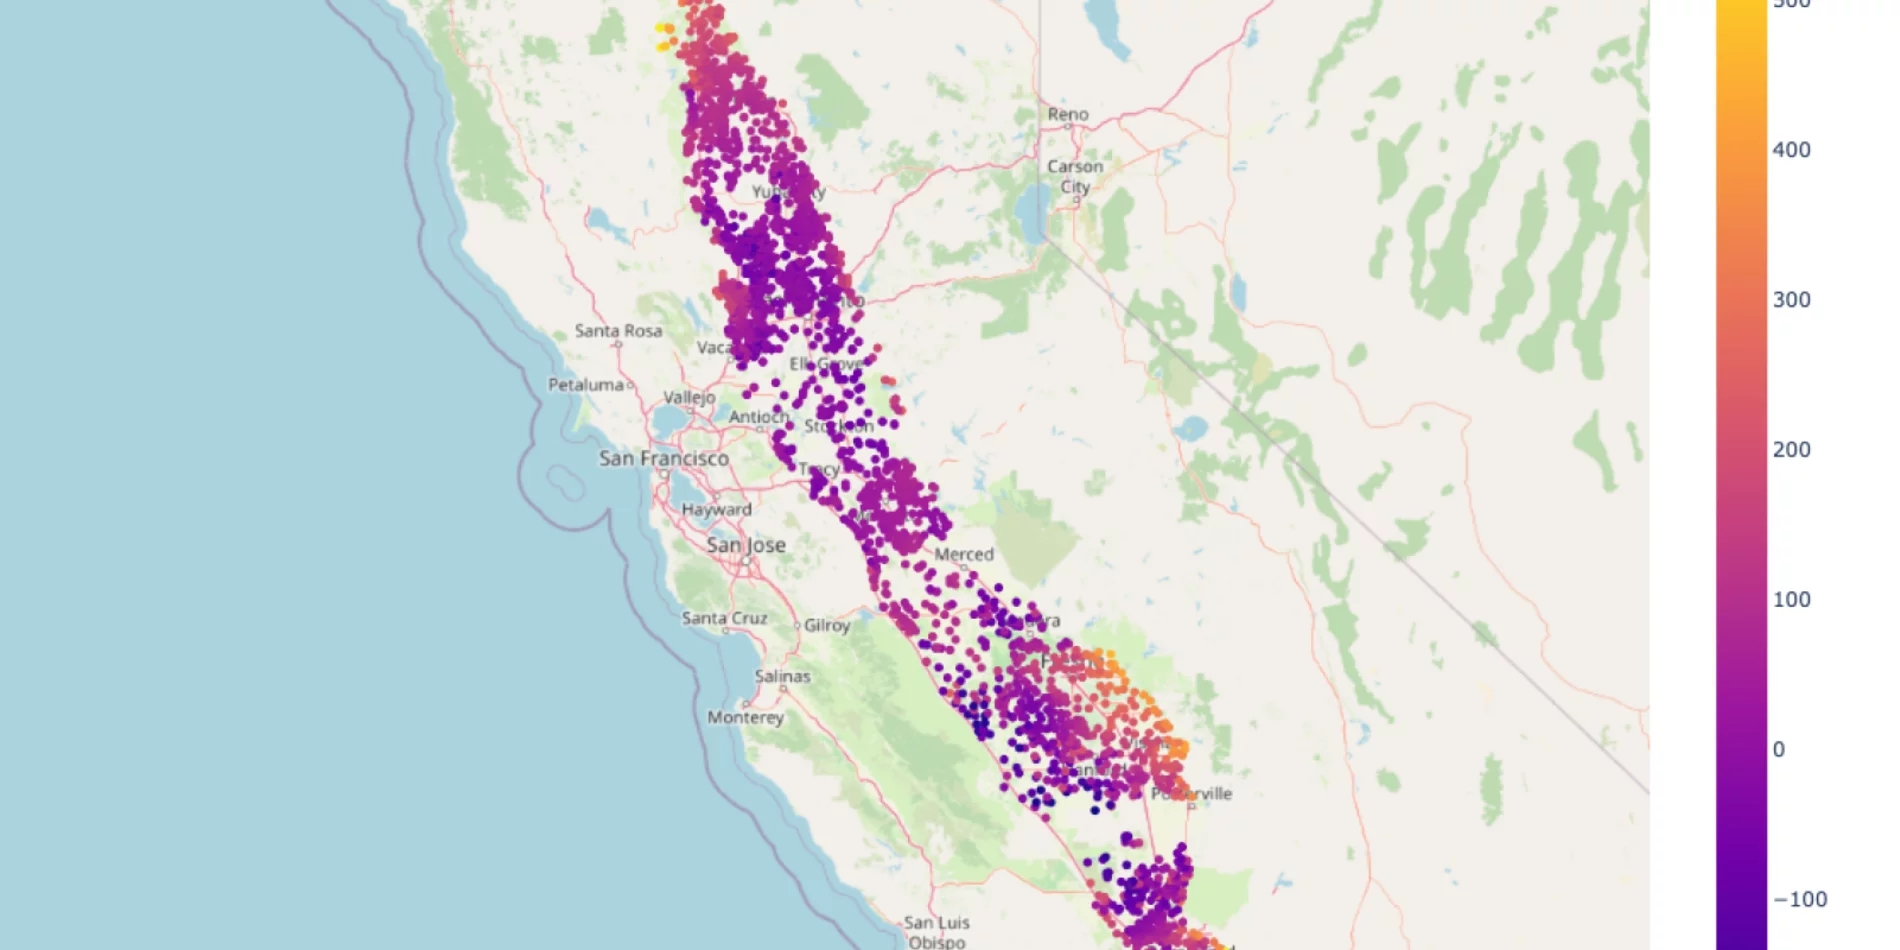
Groundwater makes up 40% to 60 % of the entire California water supply, including city and agriculture use. Especially in Central Valley, which is one of the most productive agricultural regions in the world, many farmers rely exclusively on groundwater to irrigate their lands during dry years. Overdrafting the groundwater results in land subsidence and even deplete groundwater storage permanently.
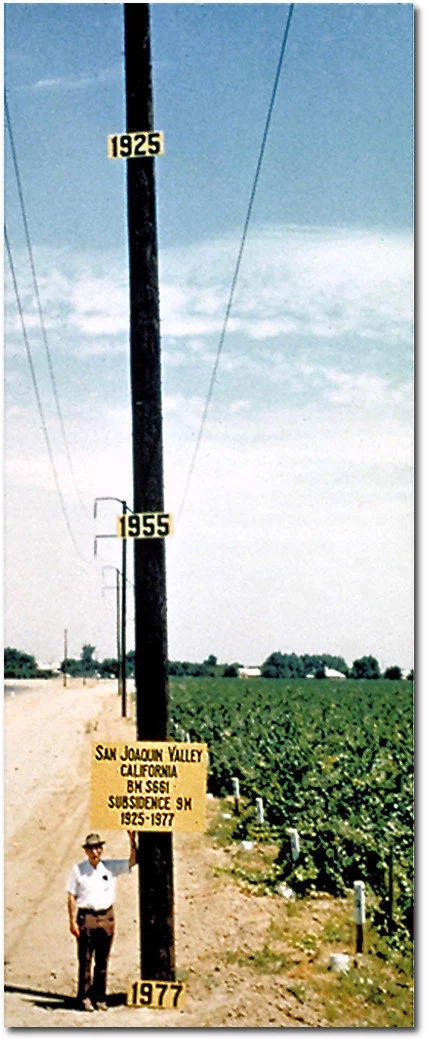 San Joaquin Valley, southwest of Mendota, California. Signs on the pole show the approximate altitude of the land surface in 1925, 1955, and 1977. The land surface subsided about 9 meters from 1925 to 1977 due to overdrafting.
Source: Dr. Joseph F. Poland, USGS
Full Colab notebook can be found here.
This article is a part of the Stanford Data Science legacy publication. Read more about the HAI and Stanford Data Science merger.
Related News

A new Stanford-led study finds that X’s “For You” algorithm mistakes outrage for interest – and fills your feed accordingly.

A new Stanford-led study finds that X’s “For You” algorithm mistakes outrage for interest – and fills your feed accordingly.
This conversation spans the evolution of AI, exploring the opportunities for AI to augment human capabilities, particularly in healthcare, education, and scientific discovery. Fei-Fei discusses the limits of today’s AI, the importance of preserving human agency, and why society, not just the technology industry, needs to play a role in shaping its future.
This conversation spans the evolution of AI, exploring the opportunities for AI to augment human capabilities, particularly in healthcare, education, and scientific discovery. Fei-Fei discusses the limits of today’s AI, the importance of preserving human agency, and why society, not just the technology industry, needs to play a role in shaping its future.
HAI Executive Director Russell Wald talks about the AI competition between the U.S. and China, and the advent of “world models” that predict what might happen in real-world environments.
HAI Executive Director Russell Wald talks about the AI competition between the U.S. and China, and the advent of “world models” that predict what might happen in real-world environments.