Using AI to Map Urban Change

This brief introduces a novel street-view image dataset and AI model as a more accurate proxy for detecting and assessing urban changes such as gentrification.
Key Takeaways
Physical changes in cities offer profound insights into demographic shifts, housing trends, neighborhood gentrification, and other issues critical to urban planning and sustainability. But many current methods for analyzing urban change are limited as they rely heavily on surveys and construction permit data.
We use Google Street View data from across the United States to curate the largest street-view time series dataset to date and build an AI model to evaluate changes in the images. Our time series data allows the AI model to more easily filter out irrelevant variations and instead focus on detecting large-scale changes to urban environments.
Using a case study in Seattle, we demonstrate that our method for urban change detection provides a scalable, more accurate proxy for assessing neighborhood and citywide socioeconomic changes.
Policymakers should look to street-view image data and AI models to identify areas undergoing change with more precision, which can enable more efficient resource allocation and earlier intervention to mitigate the potential negative impacts of gentrification.
Executive Summary
Cities are constantly evolving, and better understanding those changes facilitates better urban planning and infrastructure assessments and leads to more sustainable social and environmental interventions. Researchers currently use data such as satellite imagery to study changing urban environments and what those changes mean for public policy and urban design. But flaws in the current approaches, such as inadequately granular data, limit their scalability and their potential to inform public policy across social, political, economic, and environmental issues.
Street-level images offer an alternative source of insights. These images are frequently updated and high-resolution. They also directly capture what’s happening on a street level in a neighborhood or across a city. Analyzing street-level images has already proven useful to researchers studying socioeconomic attributes and neighborhood gentrification, both of which are essential pieces of information in urban design, sustainability efforts, and public policy decision-making for cities. Yet, much like other data sources, street-level images present challenges: accessibility limits, shadow and lighting issues, and difficulties scaling up analysis.
To address these challenges, our paper “CityPulse: Fine-Grained Assessment of Urban Change with Street View Time Series” introduces a multicity dataset of labeled street-view images and proposes a novel artificial intelligence (AI) model to detect urban changes such as gentrification. We demonstrate the change-detection model’s effectiveness by testing it on images from Seattle, Washington, and show that it can provide important insights into urban changes over time and at scale. Our data-driven approach has the potential to allow researchers and public policy analysts to automate and scale up their analysis of neighborhood and citywide socioeconomic change.
Introduction
Physical changes in urban environments offer profound insights into urban policies and economics, including housing value trends and spatial segregation effects. They also provide insights into downstream impacts, such as neighborhood gentrification and disaster recovery. At present, researchers predominantly use datasets made up of satellite and aerial imagery, survey data, and building permit data to measure physical urban change, but these methods have many limitations. Survey data is often inadequately granular, both spatially and temporally; top-down views from remote sensing data incompletely capture street-level changes that impact daily life in cities; and data on construction permits is not always accessible.
Street-view imagery provides a more comprehensive spatial representation of city development over time. Such imagery has already been used to quantify urban greenery, indicate region functions (e.g., areas used for public health or recreational purposes), uncover economic and sociodemographic patterns, predict a population’s well-being, and estimate buildings’ energy efficiency. Imagery of city streets can also be used to broadly evaluate how buildings, streets, and other city elements deteriorate and change. But current methods rely on comparing pairs of historical street-views for individual locations, which doesn’t capture the full range of transformations that can occur in cities. A comprehensive time series of street-view data would enable a more granular, insightful, and generalizable analysis of urban environments.
With that objective in mind, we collected and curated a Google Street View time series dataset with images on about 1,000 coordinates in six cities, collected from 2007 to 2023—the largest street-view change-detection dataset available to date. Each time series contains around 10 images over the 16-year period, and each image is labeled with “change” or “no change.” We then leveraged past work on the use of neural networks and machine learning techniques for change detection, commonly used in remote sensing to identify differences between two images, to train an AI model on our street-view time series dataset to analyze urban change. The AI model can extract object details and structural information about the built environment and mitigate noisy effects, thereby enabling a more fine-grained analysis of urban change. It also enables change detection at scale—so researchers can ingest more data and analyze more cities.
Related Publications
Using AI to Understand Residential Solar Power

This brief introduces a computer-vision approach to analyzing solar panel adoption in U.S. households that can help policymakers tailor incentive mechanisms.

This brief introduces a computer-vision approach to analyzing solar panel adoption in U.S. households that can help policymakers tailor incentive mechanisms.
Using Satellite Imagery to Understand and Promote Sustainable Development
This brief discusses the opportunities and limitations of AI models that can map satellite image inputs to sustainable development outcomes.

This brief discusses the opportunities and limitations of AI models that can map satellite image inputs to sustainable development outcomes.

This brief highlights the emergence of world models and outlines a first-of-its-kind governance and policy agenda for the technology.

This brief highlights the emergence of world models and outlines a first-of-its-kind governance and policy agenda for the technology.
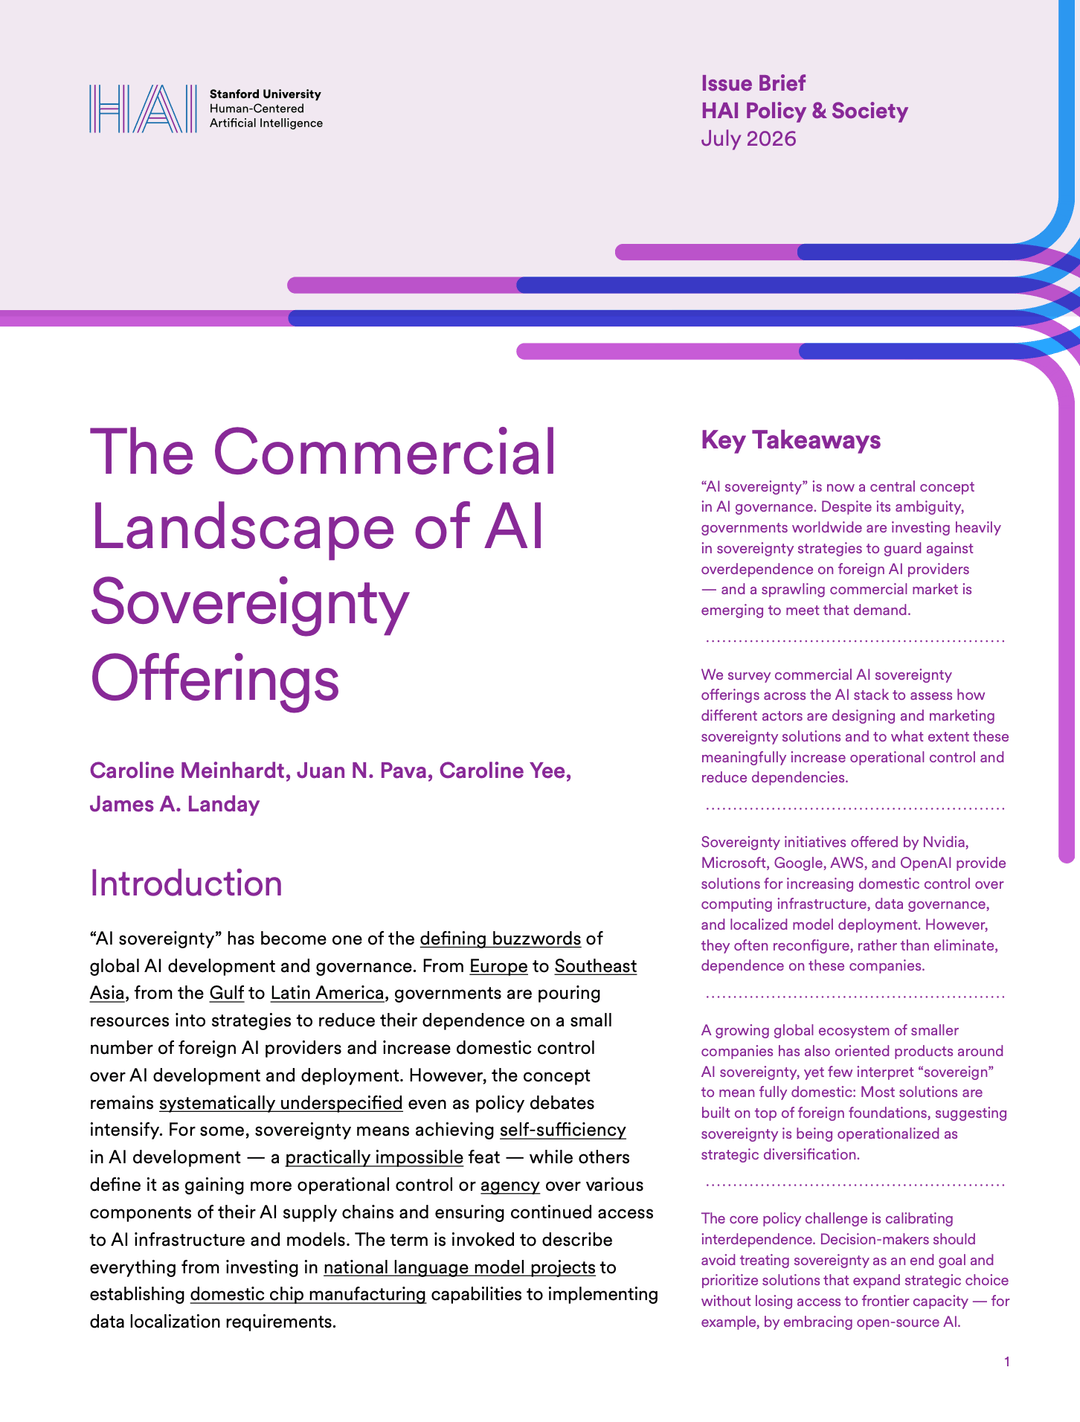
The Commercial Landscape of AI Sovereignty Offerings
This brief surveys the commercial AI sovereignty market and argues that policymakers should focus on calibrating interdependence rather than pursuing full self-sufficiency.
This brief surveys the commercial AI sovereignty market and argues that policymakers should focus on calibrating interdependence rather than pursuing full self-sufficiency.