Stanford
University
  • Stanford Home
  • Maps & Directions
  • Search Stanford
  • Emergency Info
  • Terms of Use
  • Privacy
  • Copyright
  • Trademarks
  • Non-Discrimination
  • Accessibility
© Stanford University.  Stanford, California 94305.
Economy | The 2026 AI Index Report | Stanford HAI
Skip to content
  • About

    • About
    • People
    • Get Involved with HAI
    • Support HAI
    • Subscribe to Email
  • Research

    • Research
    • Research Programs
    • Grants
    • Marlowe (opens in new tab)
    • Student Affinity Groups
    • Centers & Labs
    • Research Publications
    • Research Partners
  • Education

    • Education
    • Executive and Professional Education
    • Government and Policymakers
    • K-12
    • Stanford Students
  • Policy

    • Policy
    • Policy Publications
    • Policymaker Education
    • Student Opportunities
  • AI Index

    • AI Index
    • AI Index Report
    • Global Vibrancy Tool
    • People
  • News
  • Events
  • Industry
  • Centers & Labs
Navigate
  • About
  • Events
  • AI Glossary
  • Careers
  • Search
Participate
  • Get Involved
  • Support HAI
  • Contact Us

Stay Up To Date

Get the latest news, advances in research, policy work, and education program updates from HAI in your inbox weekly.

Sign Up For Latest News

04

Economy

Economy, Markets

This chapter analyzes the economic footprint  of AI across the private sector and its implications for labor markets, productivity, and the future of work.


Download Full Chapter
See Chapter 5

All Chapters

  • Back to Overview
  • 01Research and Development
  • 02Technical Performance
  • 03Responsible AI
  • 04Economy
  • 05Science
  • 06Medicine
  • 07Education
  • 08Policy and Governance
  • 09Public Opinion

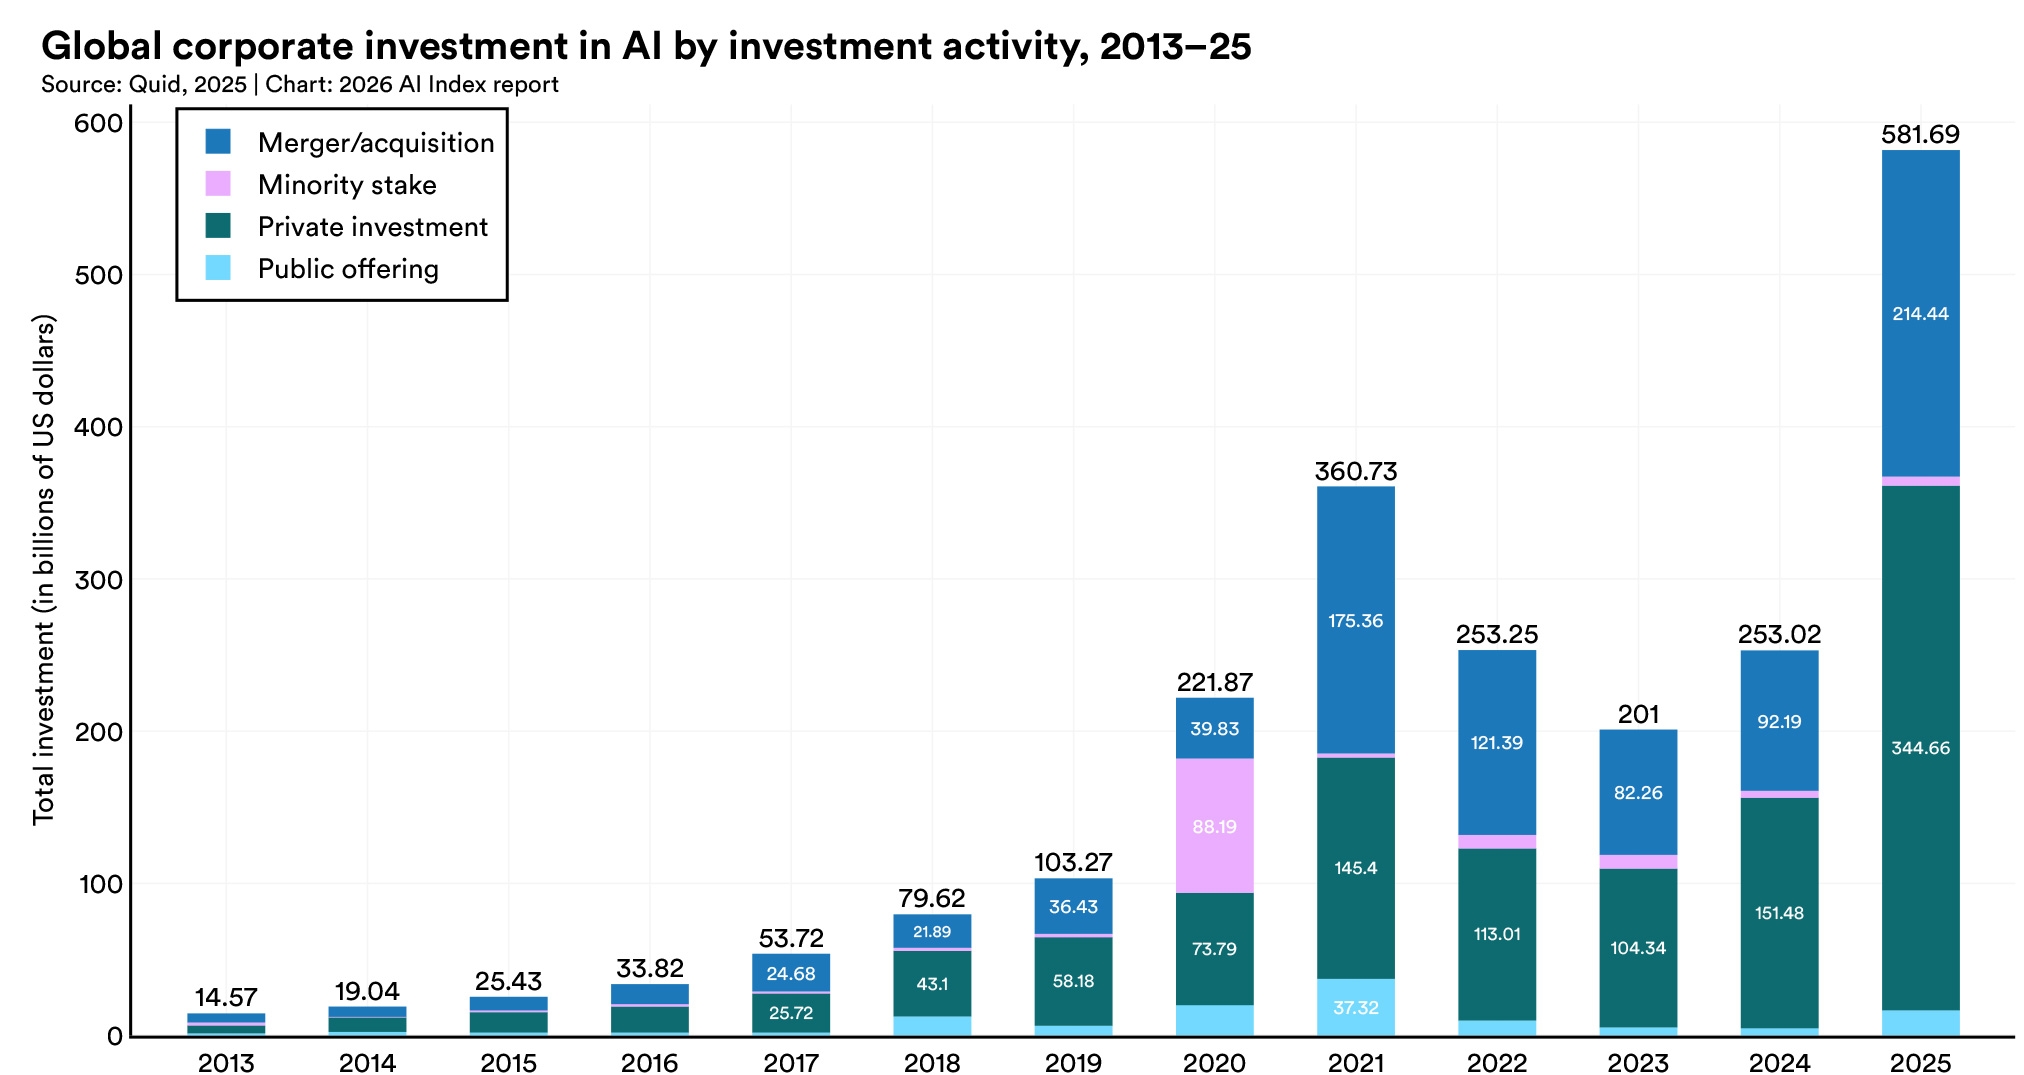
1. Global corporate AI investment more than doubled in 2025.

Private investment grew fastest at 127.5% and now accounts for 60% of the total. Generative AI led the surge, growing more than 200% and capturing nearly half of all private AI funding. Newly funded AI companies rose 71%, and billion-dollar funding events nearly doubled.

Stacked bar chart showing global corporate AI investment by activity from 2013–25, in billions of US dollars. Total investment rose from $14.57 billion to a record $581.69 billion in 2025, led by private investment ($344.66 billion) and mergers and acquisitions ($214.44 billion).

2. The United States continues to lead in global private AI investment, committing 23 times more than China.

In generative AI, U.S. investment exceeded the combined total of China and Europe by a wide margin. However, private investment figures likely understate China’s total AI spending, as government guidance funds have deployed an estimated $184 billion into AI firms between 2000 and 2023.
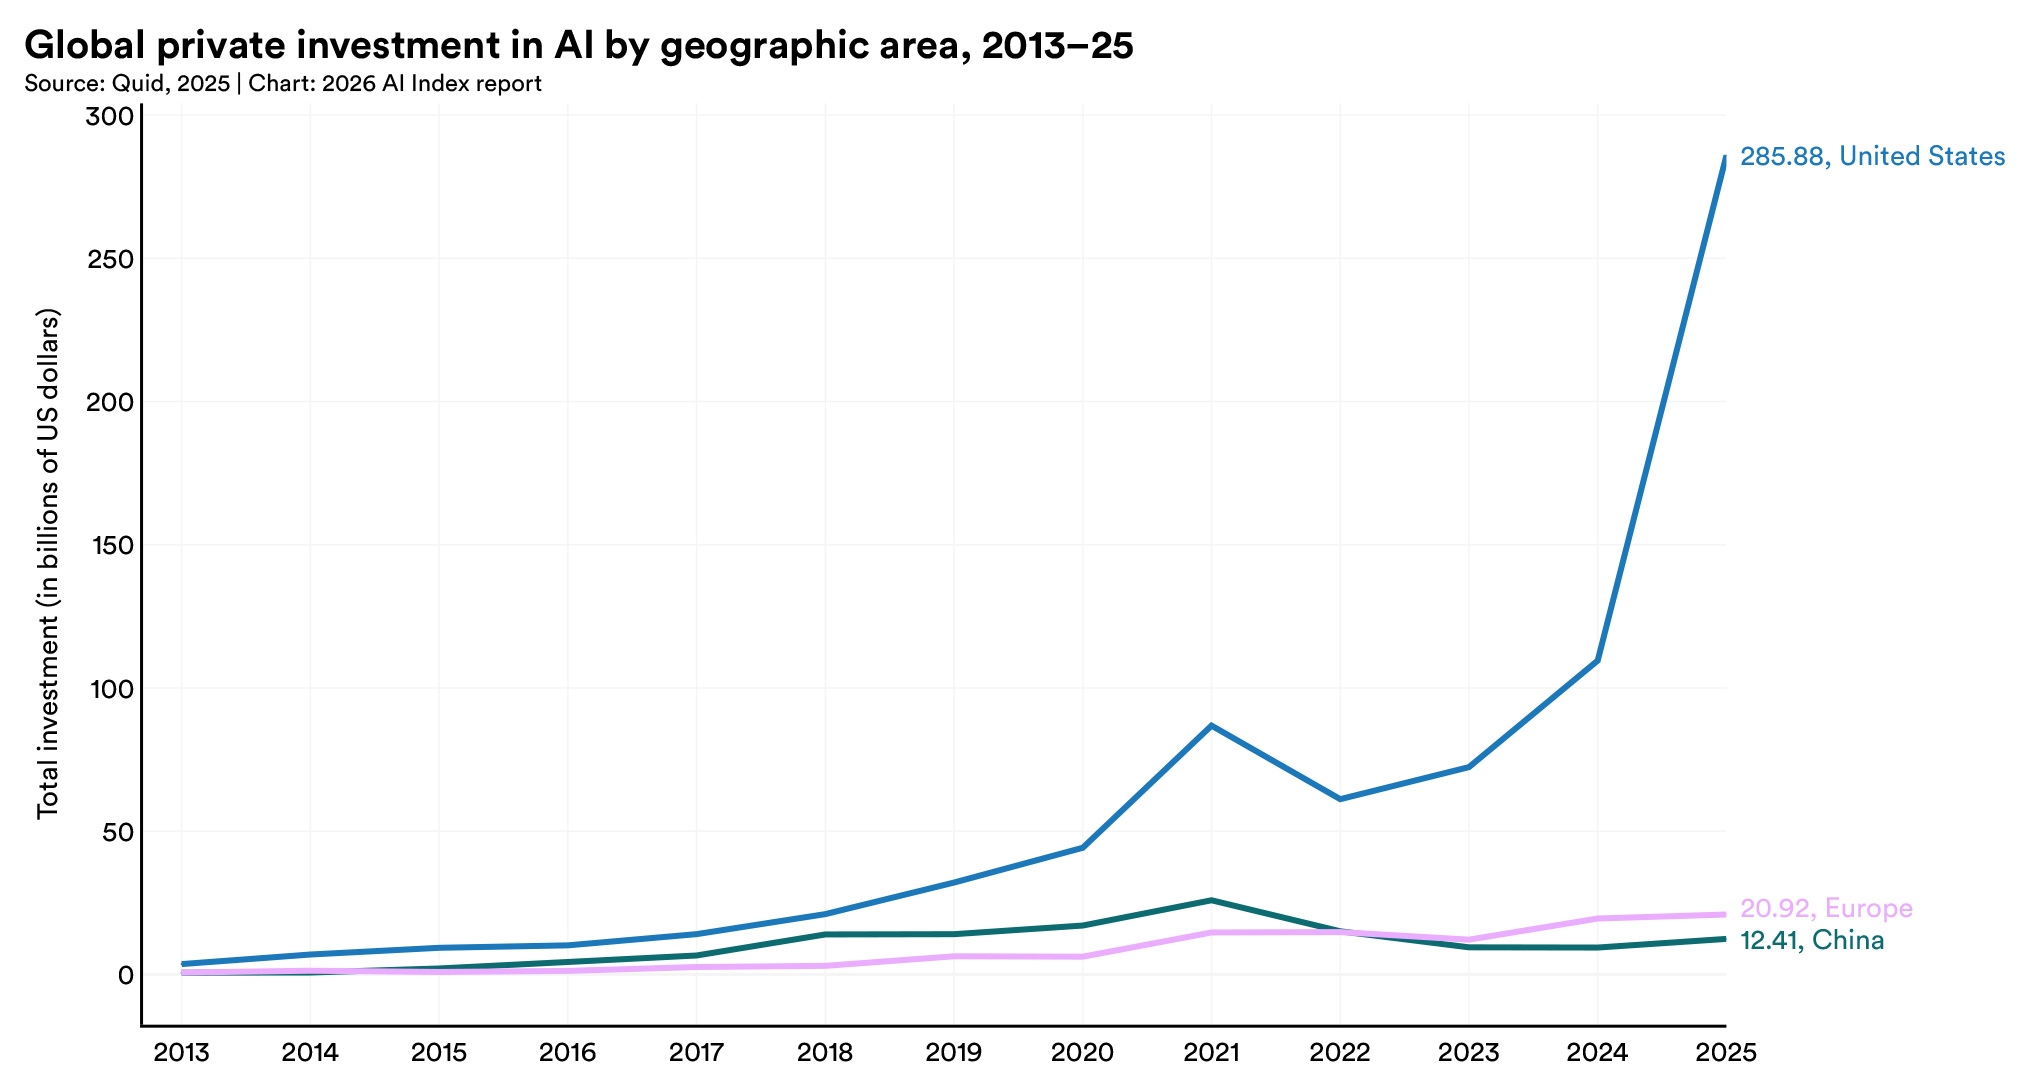
Line chart showing US AI investment surging to $285.88 billion in 2025, far above Europe ($20.92 billion) and China ($12.41 billion).

3. AI company revenue is rising at historically fast rates, but compute costs and infrastructure spending are also reaching record levels.

Leading frontier companies are reaching meaningful revenue scale in a short period of time, but compute spend has increased significantly year-over-year. Major cloud providers have accelerated capital expenditures, with Google reporting more than $150 billion in annual capex in 2025.
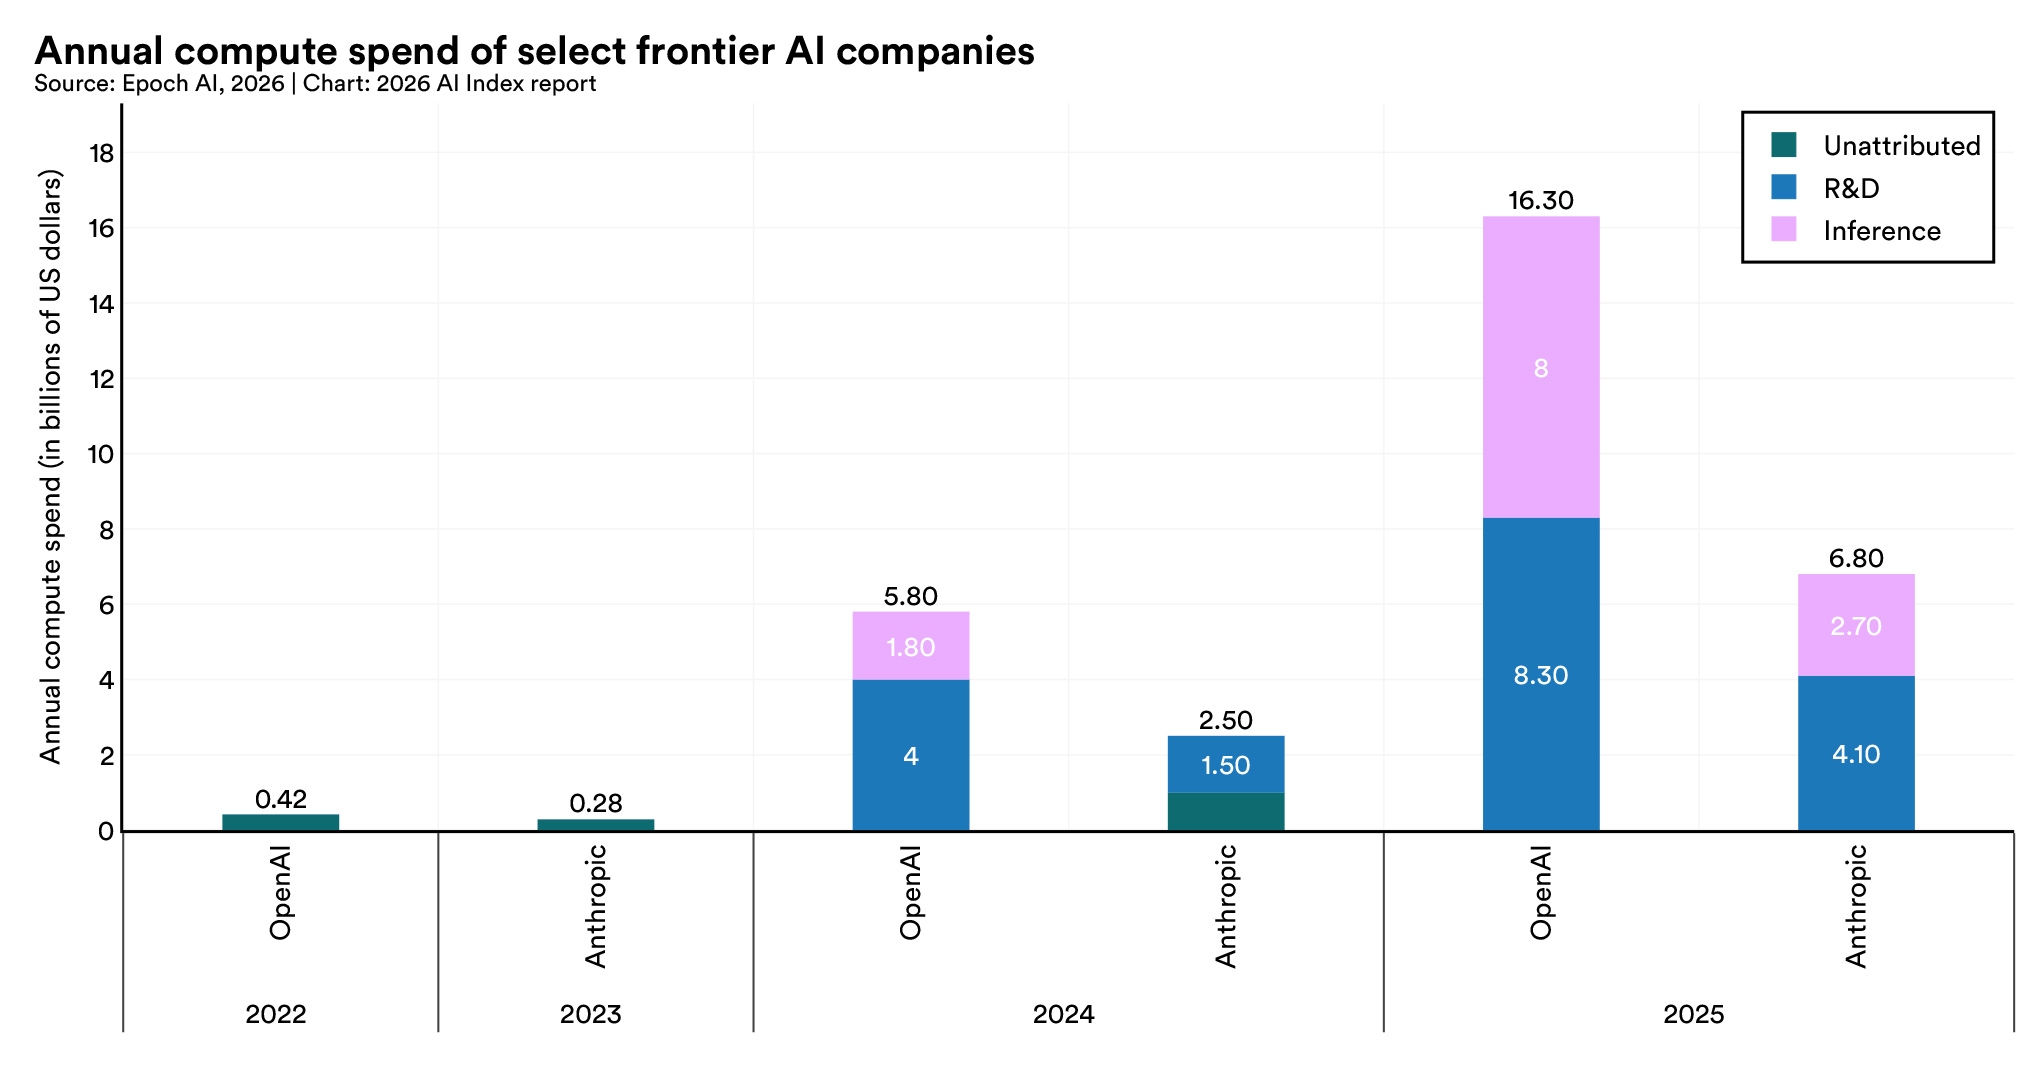
Stacked bar chart showing annual compute spending by OpenAI and Anthropic, rising to $16.3 billion and $6.8 billion, respectively, in 2025. Spending is divided into R&D, inference, and unattributed costs.

4. The value consumers get from generative AI grew 54% in a year.

Estimated U.S. consumer surplus reached $172 billion annually by early 2026, up from $112 billion a year earlier, with the median value per user tripling over the same period. Most of these tools remain free or close to it.
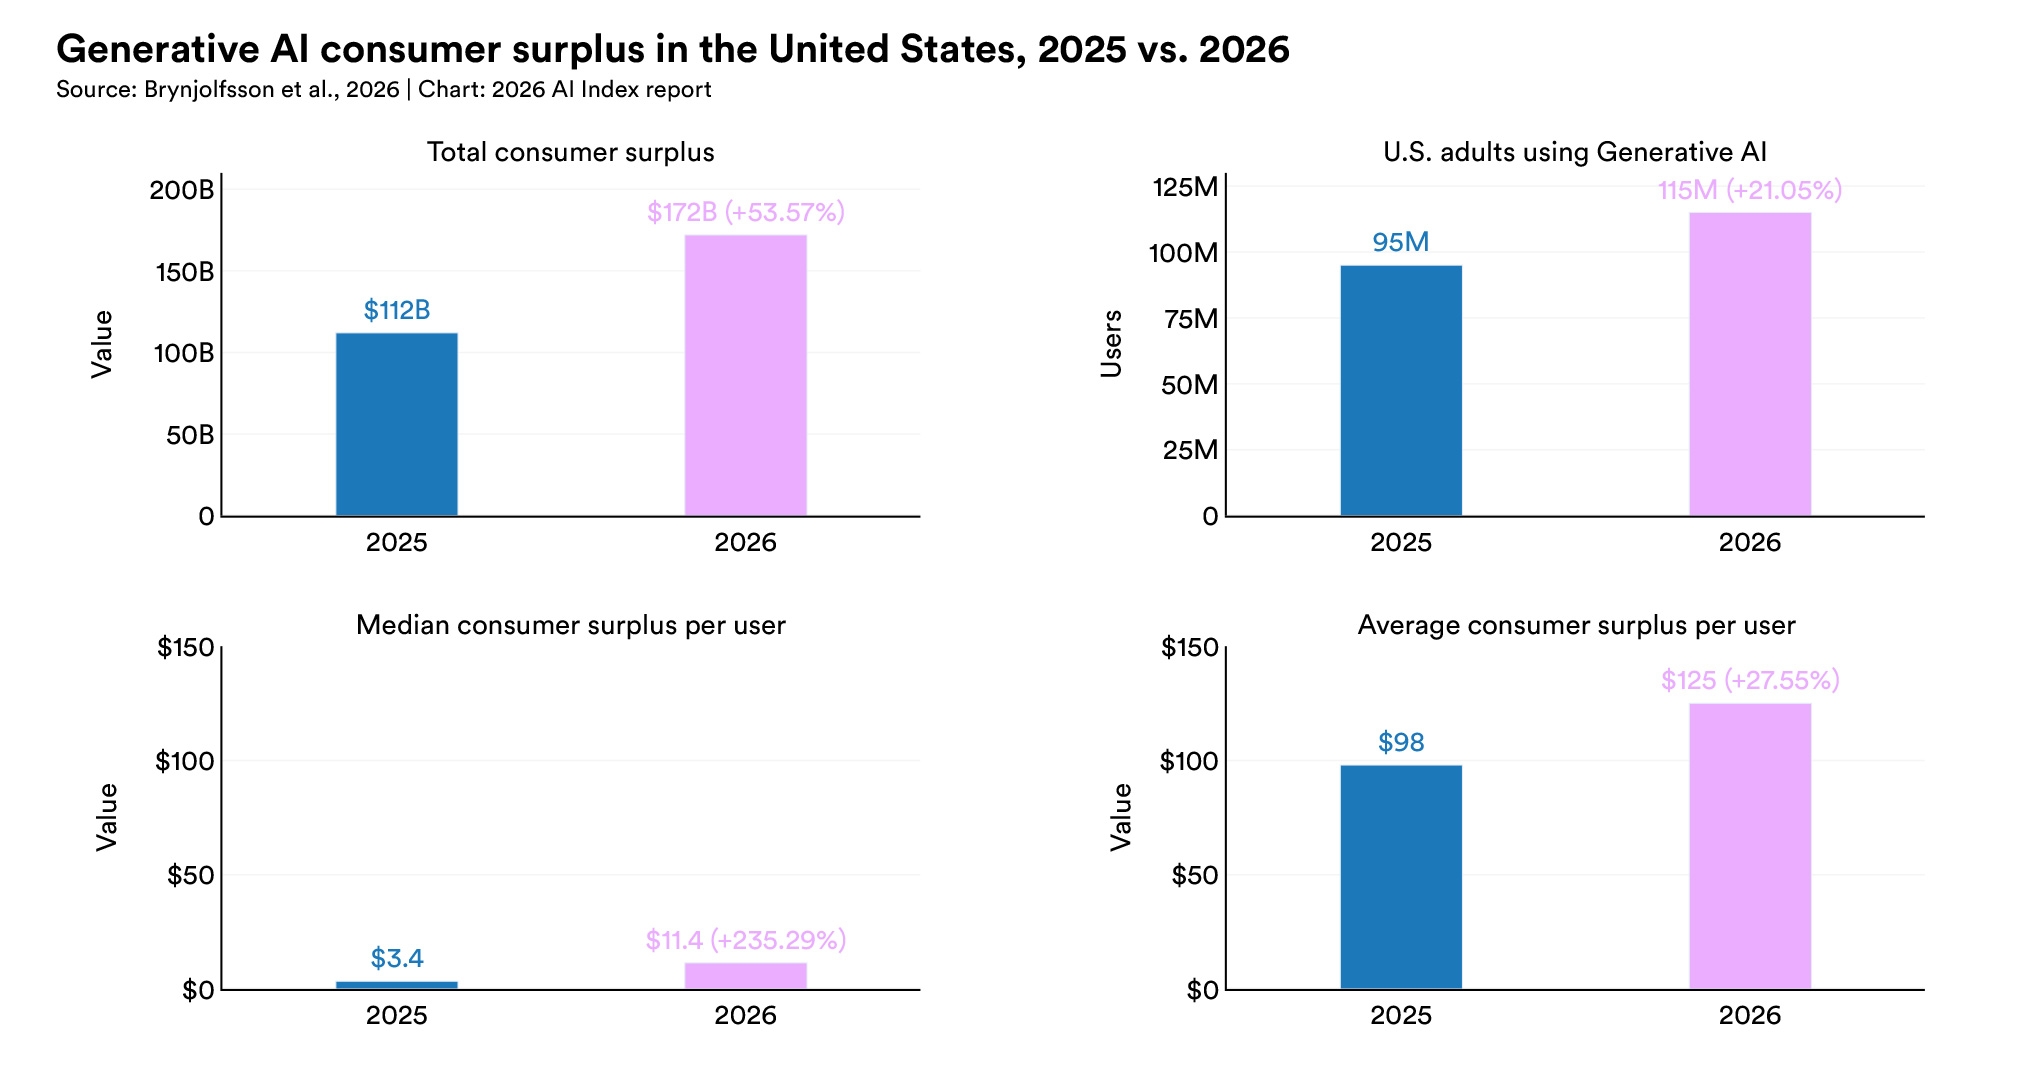
Four charts show U.S. generative AI consumer surplus rising from 2025 to 2026, with total value growing from 112 billion to 172 billion dollars and users from 95 million to 115 million.

5. Organizational AI adoption continued to rise in 2025, up to 88% of surveyed organizations, though AI agent use remains early.

Generative AI is now used in at least one business function at 70% of organizations, and China and Europe posted the highest year-over-year increases. AI agent deployment was in the single digits across nearly all business functions.
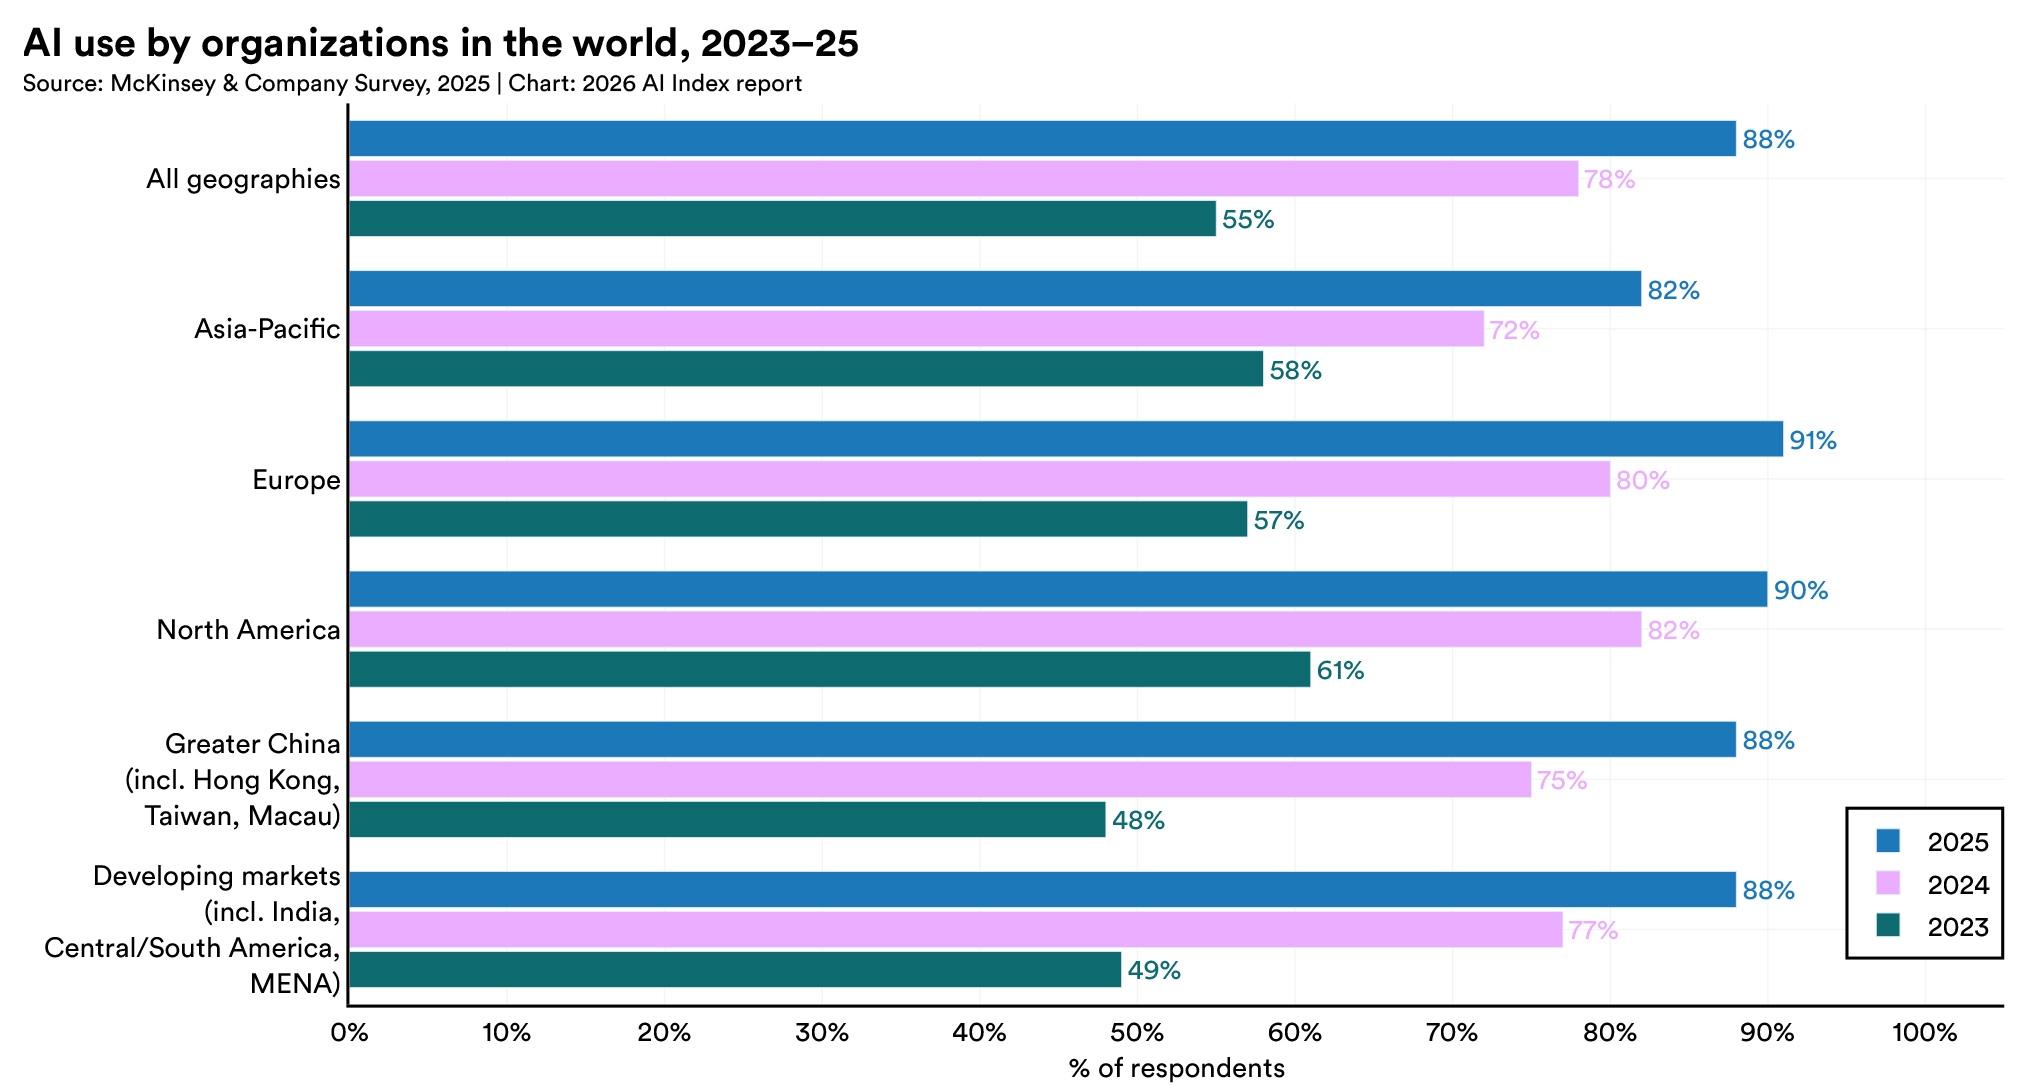
Horizontal bar chart showing AI use by organizations in the world, 2023–25. Global adoption rose from 55% in 2023 to 88% in 2025; Europe led regions at 91%, followed by North America at 90%.

6. Generative AI reached 53% adoption in three years, faster than the personal computer or the internet.

Adoption varies widely across countries and correlates strongly with GDP per capita, though some outpace what income would predict, including Singapore at 61% and the United Arab Emirates at 64%. Despite its lead in AI investment and model development, the United States ranks 24th at 28.3%.
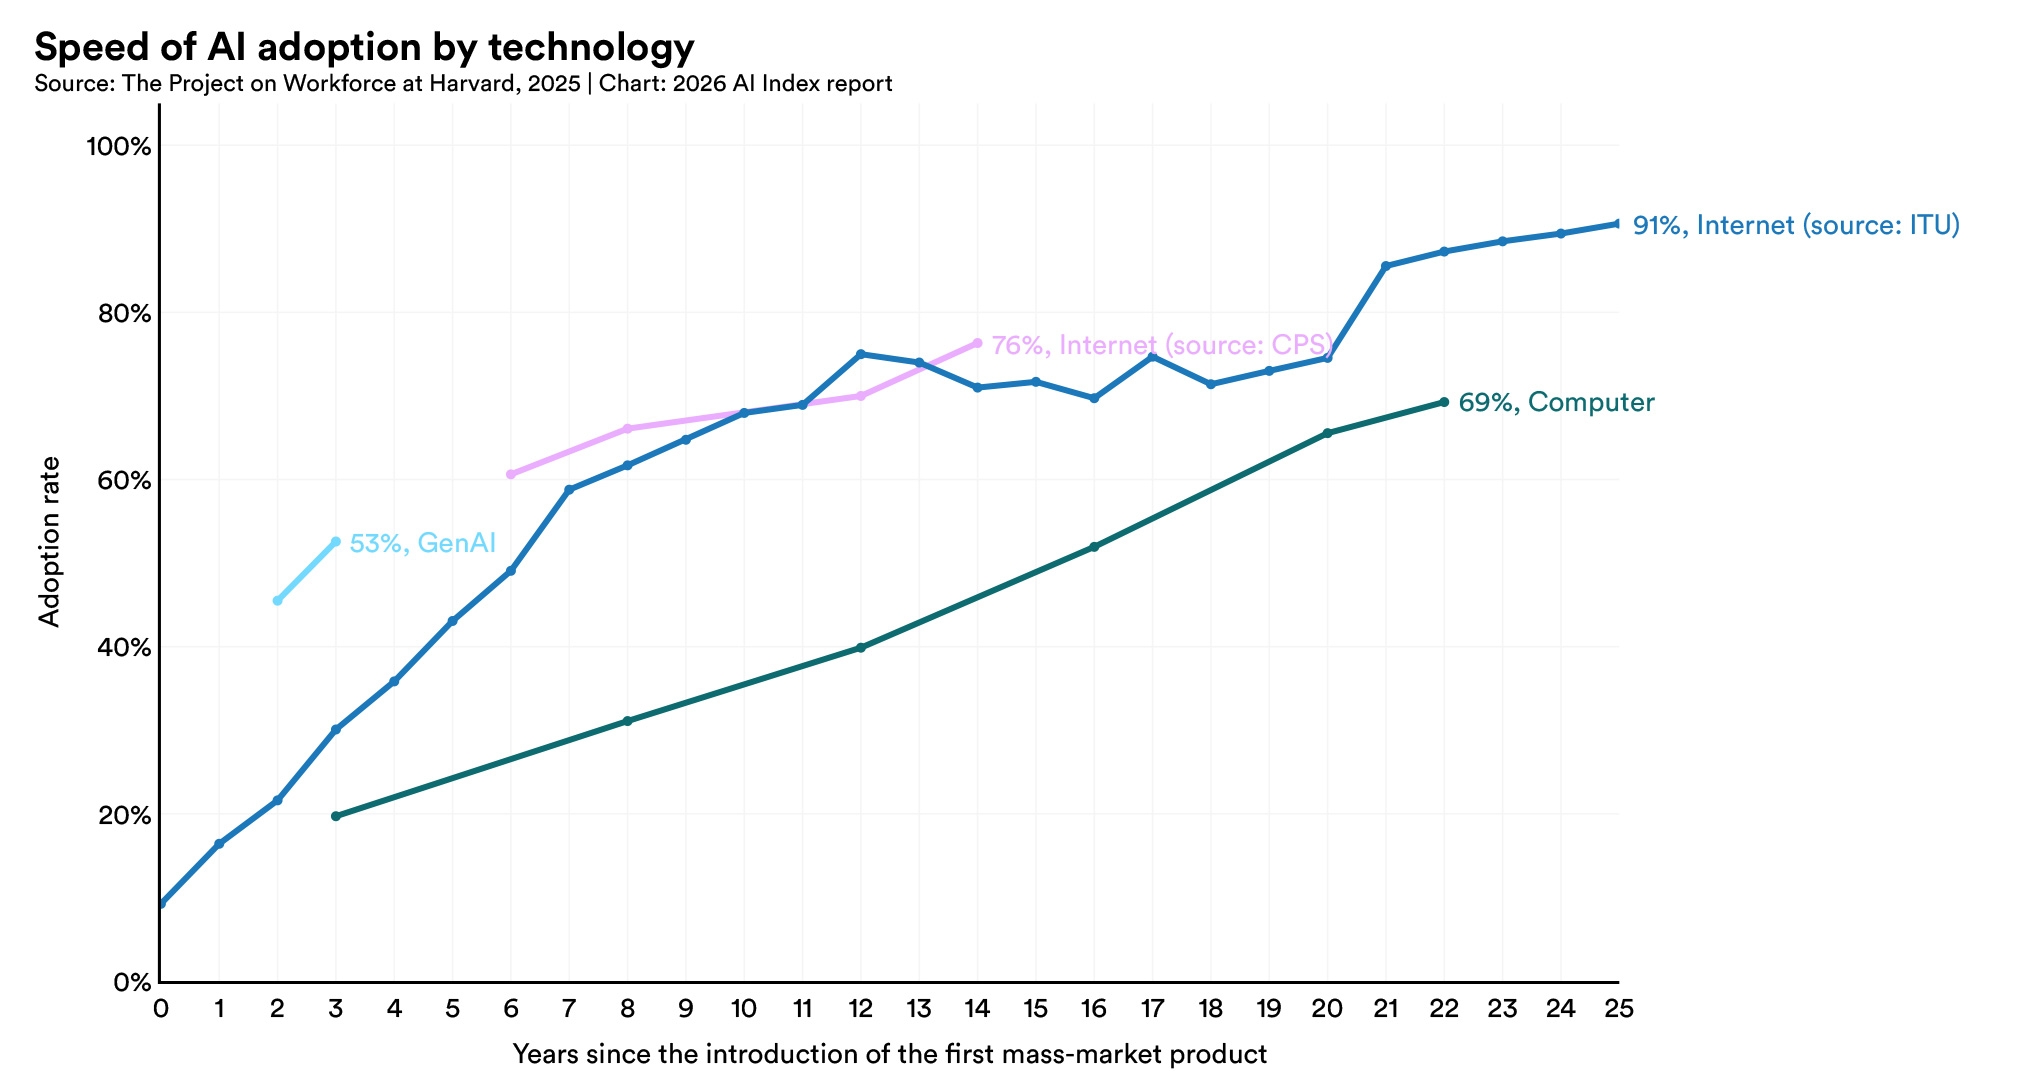
Line chart showing generative AI reaching 53% adoption within three years, faster than the internet or computers at the same stage.

7. AI's labor market effects are showing up unevenly, concentrated in hiring pipelines and the youngest workers in exposed occupations.

Employment for software developers ages 22 to 25 has fallen nearly 20% from 2024. Employer surveys point to further change ahead, with one-third of respondents expecting workforce reductions over the coming year.
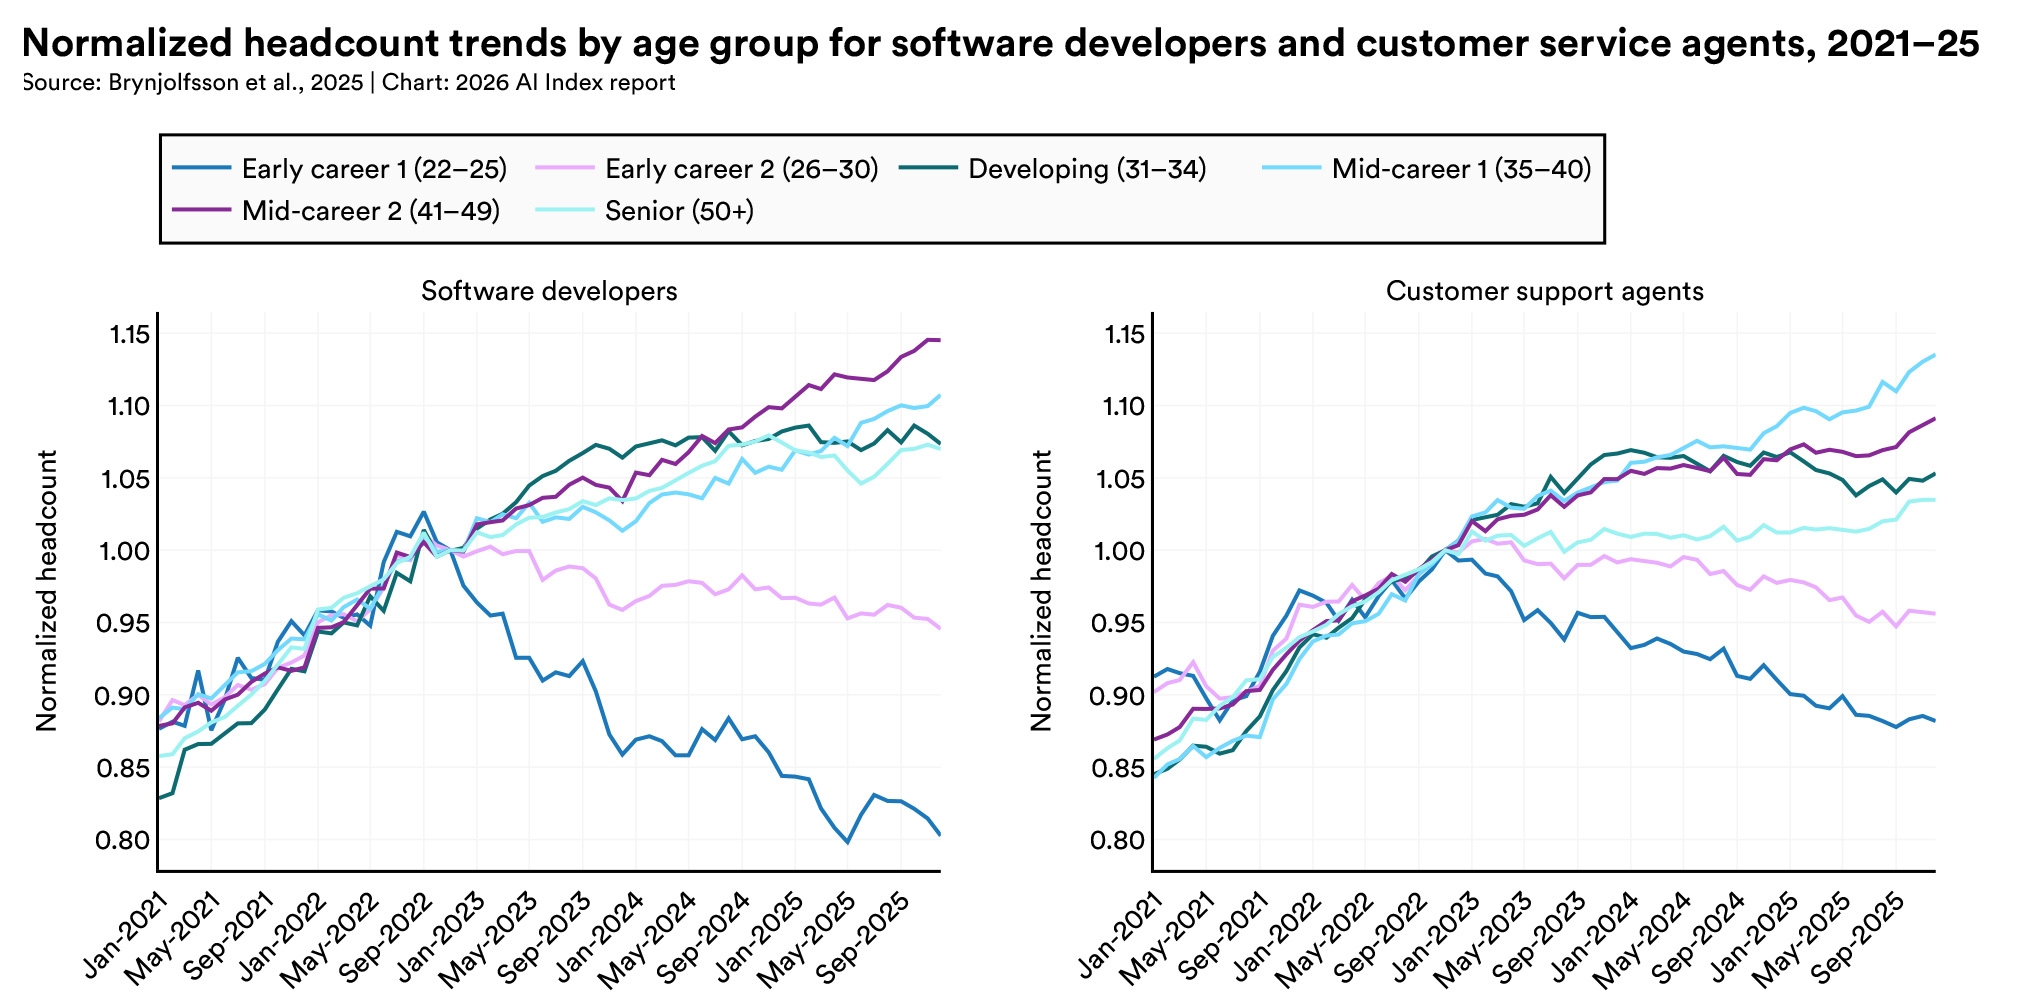
Two line charts show normalized headcounts from 2021 to 2025 for software developers and customer support agents by age group. Headcounts fell for ages 22–25 in both jobs, while most older groups grew.

8. One-third of organizations expect AI to reduce their workforce in the coming year, even though large-scale job losses have not yet shown up in overall employment data.

Almost half of organizations surveyed expected little to no change. Anticipated reductions are highest in service operations, supply chain, and software engineering. Across nearly all functions, anticipated decreases outpaces those already observed.
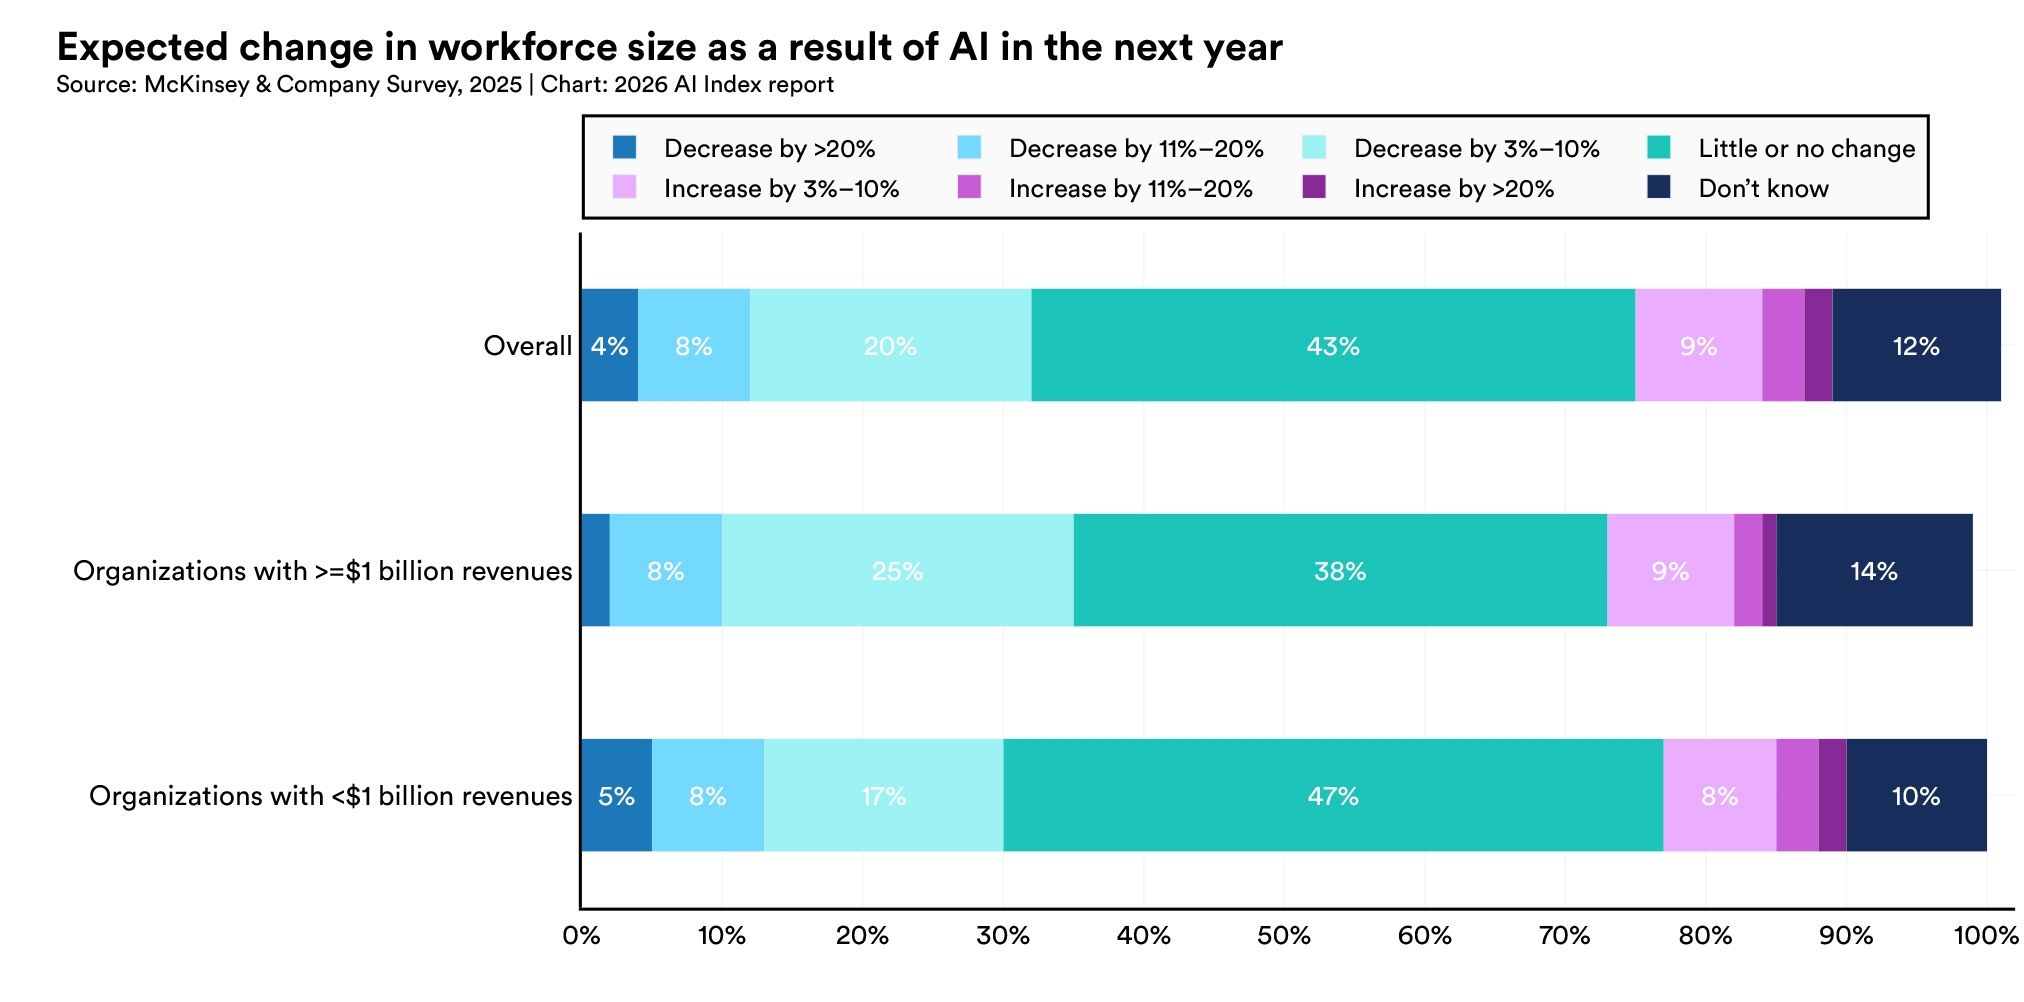
Stacked horizontal bar chart of expected AI-related workforce changes next year. Overall, 43% expect little or no change, 32% expect a decrease, 13% expect an increase, and 12% don’t know. Larger organizations are more likely to expect decreases than smaller ones.

9. Productivity gains from AI are largest in structured, measurable work where outputs are easy to monitor.

Studies report gains of 14% to 15% in customer support, 26% in software development, and 50% in marketing output. Gains are smaller in tasks requiring deeper reasoning, and recent evidence raises concerns that heavy AI reliance may carry long-term learning penalties that slow skill development over time.

Illustration of a person pushing a large dark block as blue and teal arrows flow forward, with a rising “100+” symbol suggesting growth or progress.

10. China continues to install more industrial robots than the rest of the world combined, and the gap widened in 2024.

China accounted for 54% of industrial robots installed globally, up from 51.1% in 2023. Global year-over-year growth was flat, and several major markets, including the United States, Germany, and Italy saw declines. Taiwan was an exception, recording the highest year-over-year growth at 33%.
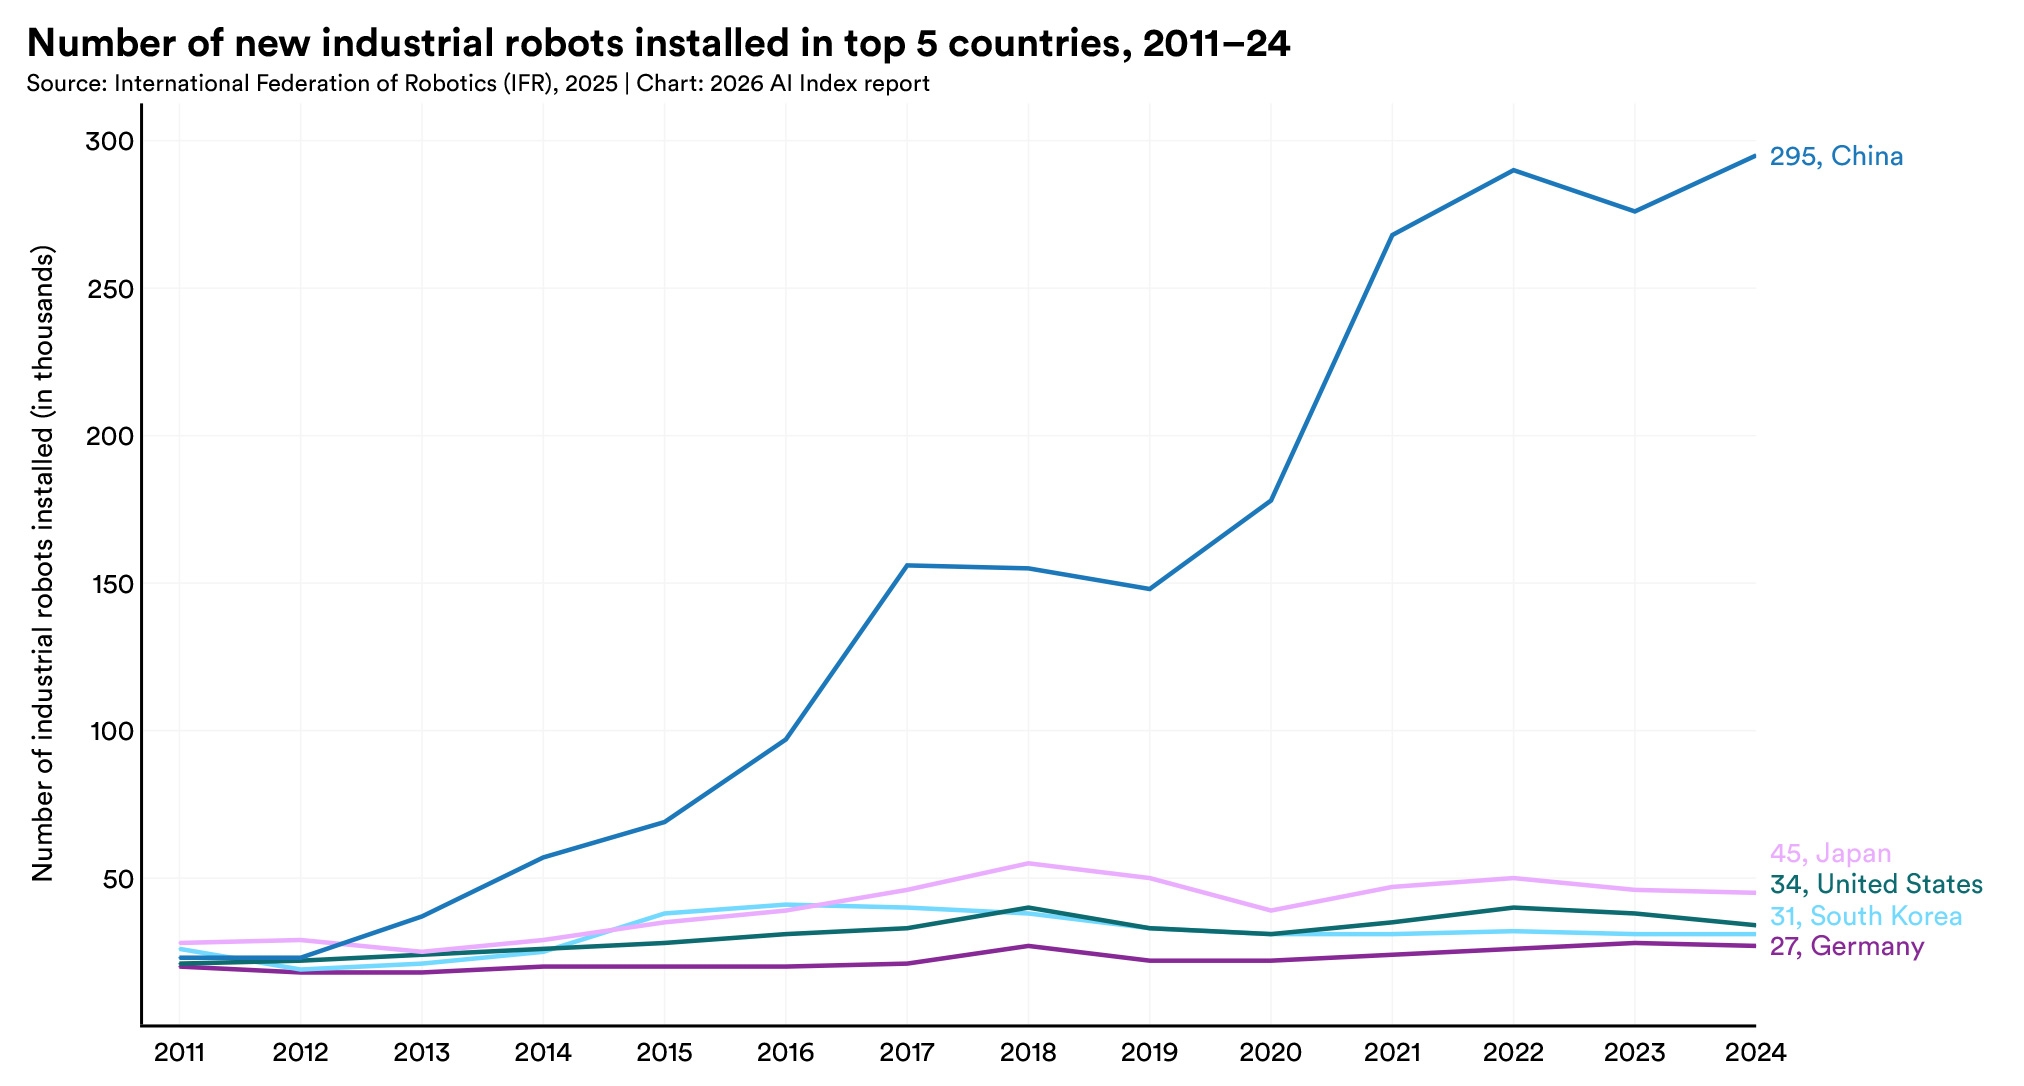
Line chart showing new industrial robot installations in the top five countries, 2011–24. China led with 295,000 installations in 2024, followed by Japan (45,000), the United States (34,000), South Korea (31,000), and Germany (27,000).


Support the AI Index in our mission to provide comprehensive, unbiased data on artificial intelligence worldwide. Your support sustains rigorous research, data collection, and analysis that informs policymakers, researchers, journalists, and business leaders—ensuring transparent AI metrics guide humanity toward a better future.

Make a Gift to AI Index