Stanford
University
  • Stanford Home
  • Maps & Directions
  • Search Stanford
  • Emergency Info
  • Terms of Use
  • Privacy
  • Copyright
  • Trademarks
  • Non-Discrimination
  • Accessibility
© Stanford University.  Stanford, California 94305.
Skip to content
  • About

    • About
    • People
    • Get Involved with HAI
    • Support HAI
    • Subscribe to Email
  • Research

    • Research
    • Research Programs
    • Grants
    • Marlowe (opens in new tab)
    • Student Affinity Groups
    • Centers & Labs
    • Research Publications
    • Research Partners
  • Education

    • Education
    • Executive and Professional Education
    • Government and Policymakers
    • K-12
    • Stanford Students
  • Policy

    • Policy
    • Policy Publications
    • Policymaker Education
    • Student Opportunities
  • AI Index

    • AI Index
    • AI Index Report
    • Global Vibrancy Tool
    • People
  • News
  • Events
  • Industry
  • Centers & Labs
Navigate
  • About
  • Events
  • AI Glossary
  • Careers
  • Search
Participate
  • Get Involved
  • Support HAI
  • Contact Us

Stay Up To Date

Get the latest news, advances in research, policy work, and education program updates from HAI in your inbox weekly.

Sign Up For Latest News

08

Policy and Governance

Regulation, Policy, Governance

This chapter surveys the global policy landscape, highlighting policymaking and public investment in AI, and the rising emphasis on AI sovereignty. 

Download Full Chapter
See Chapter 9

All Chapters

  • Back to Overview
  • 01Research and Development
  • 02Technical Performance
  • 03Responsible AI
  • 04Economy
  • 05Science
  • 06Medicine
  • 07Education
  • 08Policy and Governance
  • 09Public Opinion

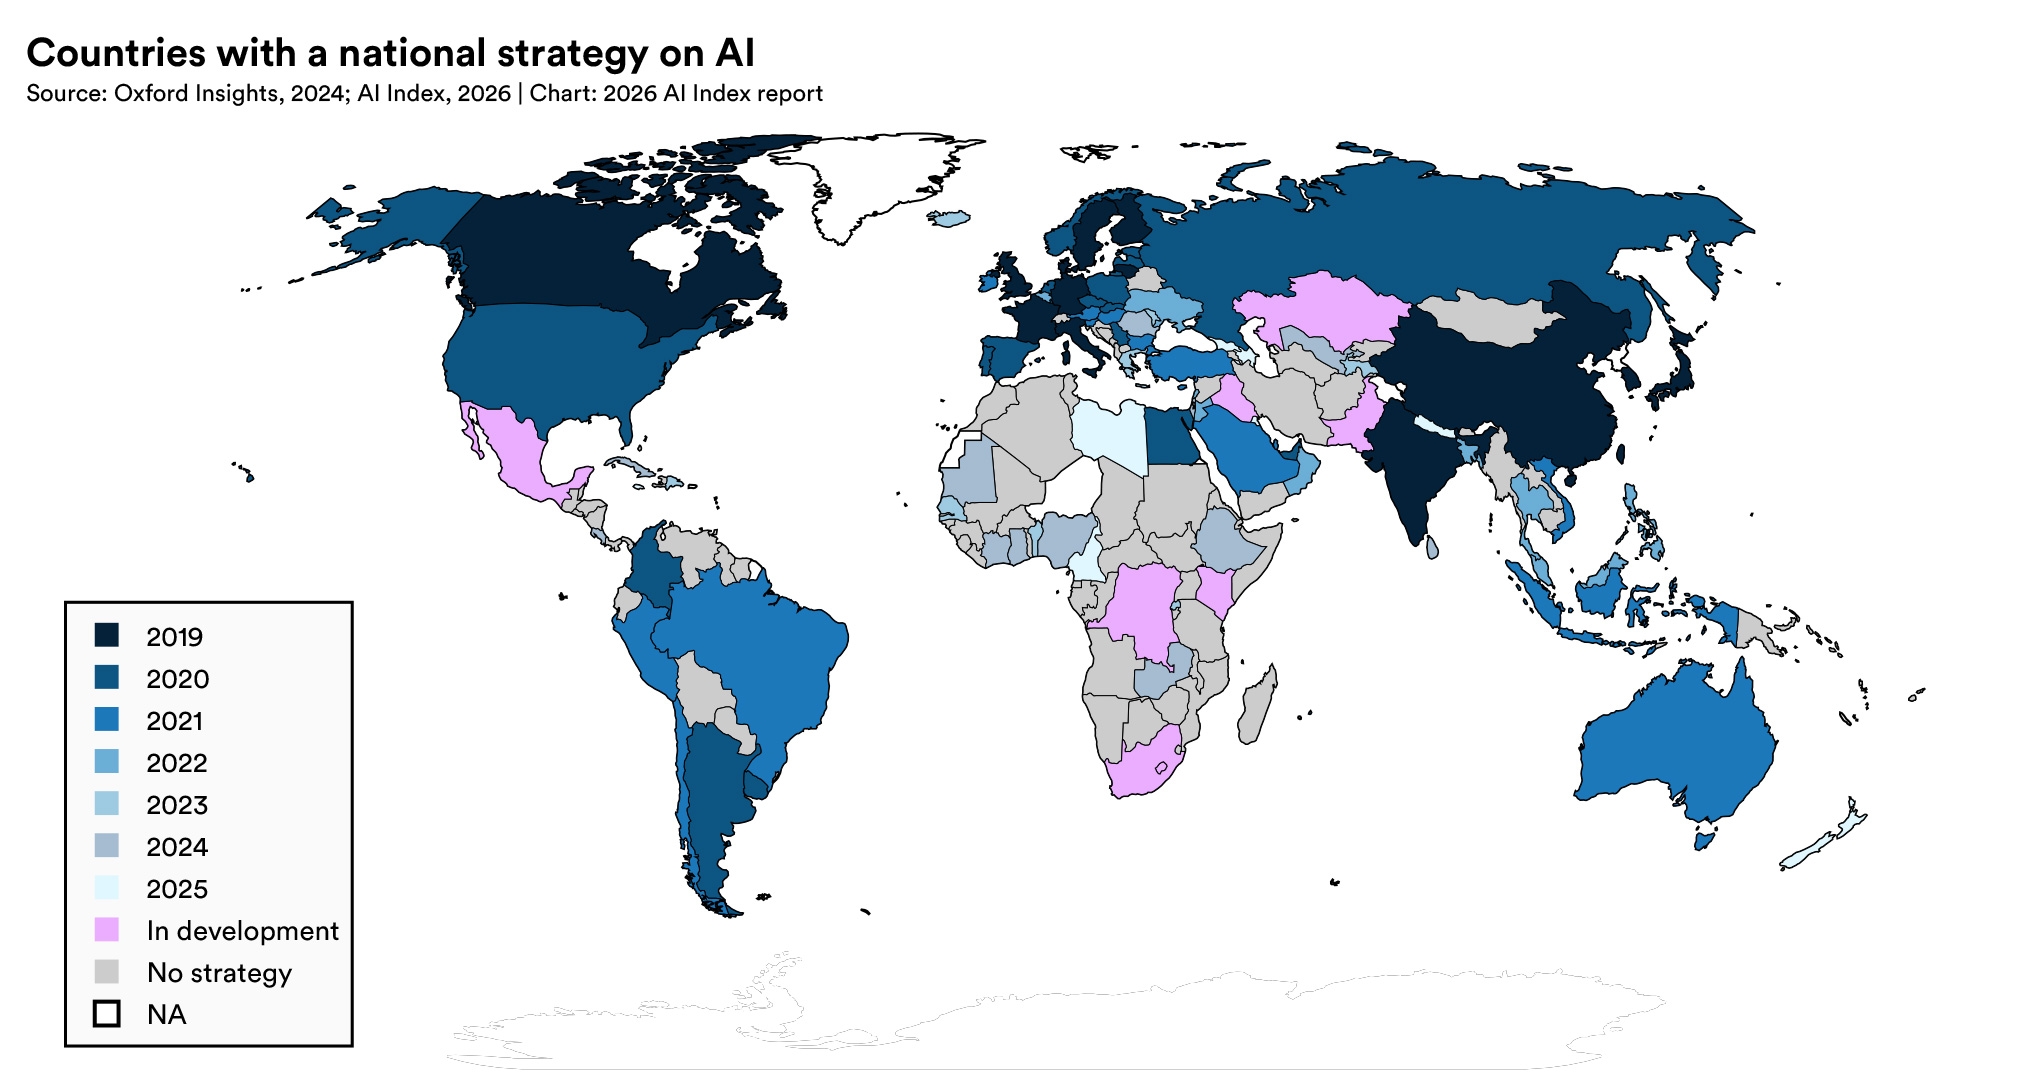
1. National AI strategies are expanding fastest among countries that had no formal AI policy five years ago.

In 2024, more than half of newly adopted strategies came from emerging economies and, as of 2025, additional countries across sub-Saharan Africa, Central Asia, and the Middle East have strategies in active development.

World map showing the status of national AI strategies by country. Countries are color-coded by the year their strategy was adopted, from dark navy for 2019 through lighter blue shades for 2020–2025. Purple indicates a strategy is in development, gray indicates no national AI strategy, and white indicates data is unavailable. National strategies are most common across North America, Europe, East Asia, Australia, and parts of Latin America and the Middle East.

2. AI sovereignty, the goal of gaining more agency over domestic AI capabilities, is emerging as a central principle of national AI policy, but the infrastructure underpinning it is unevenly distributed.

Between 2018 and 2025, Europe and Central Asia expanded state-backed AI supercomputing clusters from 3 to 44. South Asia, Latin America, and the Middle East and North Africa have only reached between 2, 3 and 8 each.
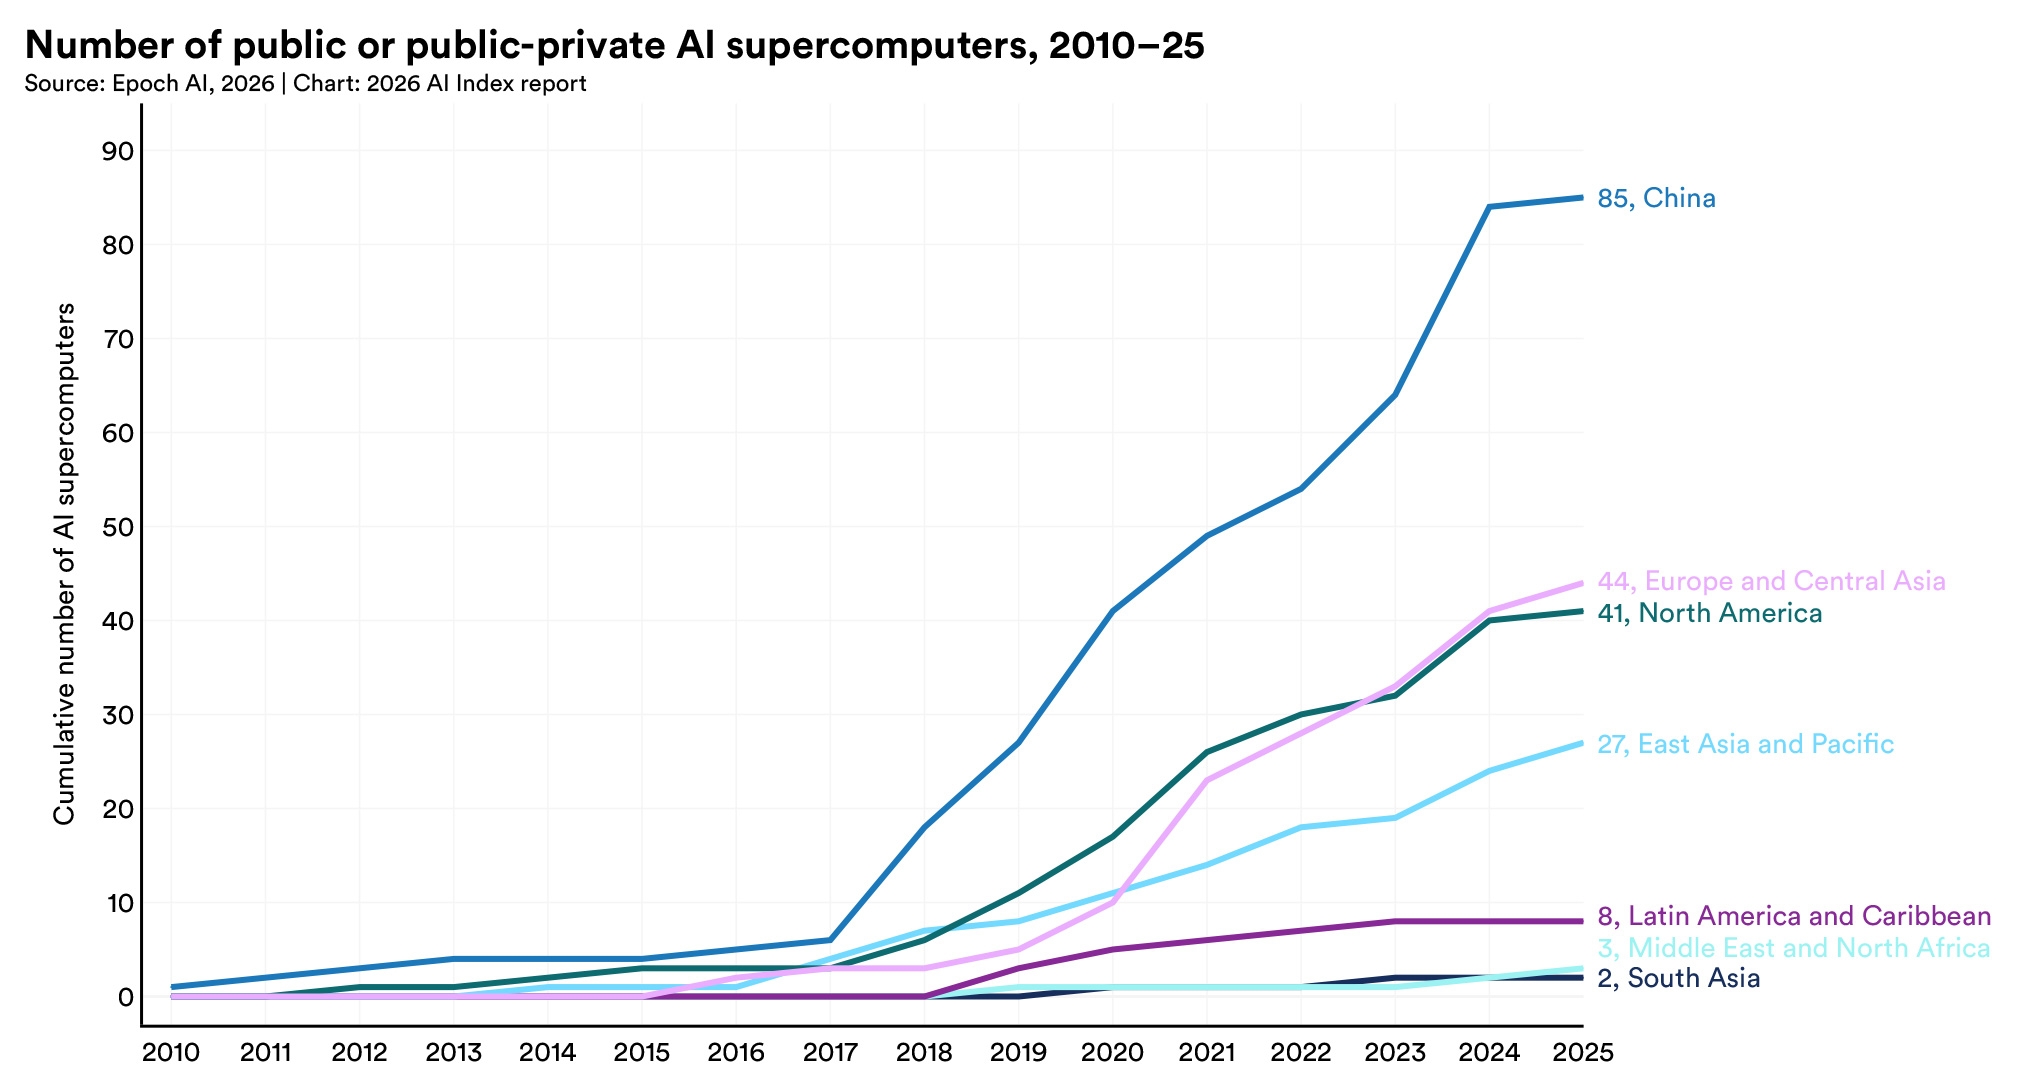
Line chart showing the cumulative number of public or public-private AI supercomputers by region from 2010 to 2025. China rises sharply after 2017 and leads with 85 systems in 2025. Europe and Central Asia has 44, North America 41, East Asia and the Pacific 27, Latin America and the Caribbean 8, and the Middle East and North Africa and South Asia each have 3.

3. Regions are taking different approaches to data sovereignty.

Through 2024, East Asia and the Pacific had adopted 77 data localization measures, followed by sub-Saharan Africa with 71 and Europe and Central Asia with 66. North America, by contrast, recorded only 3, reflecting a different approach to cross-border data flows.
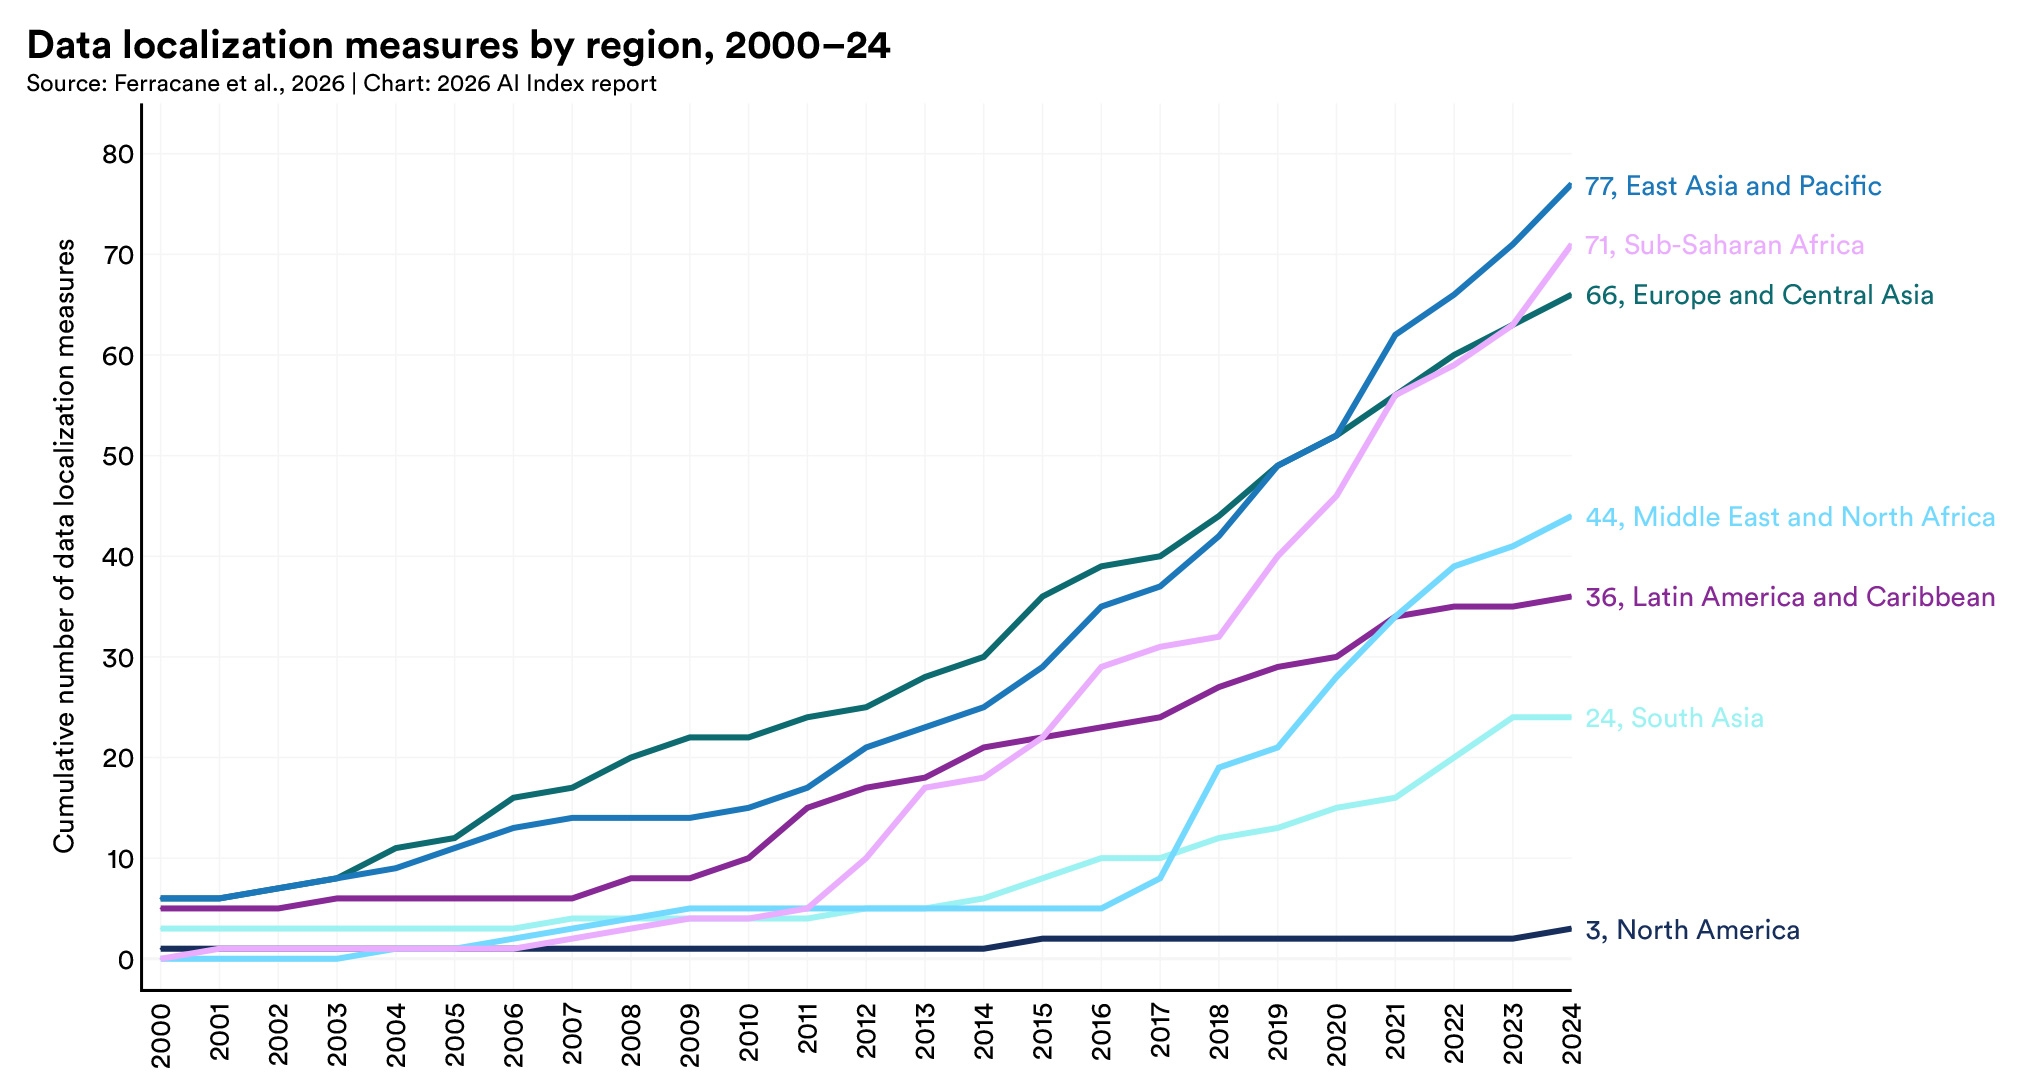
Line chart showing the cumulative number of data localization measures by region from 2000 to 2024. East Asia and the Pacific, Sub-Saharan Africa, and Europe and Central Asia have the highest totals, with sharp growth since the mid-2010s. North America remains far below other regions.

4. AI-related witnesses in U.S. congressional hearings have grown twentyfold since 2017.

The number rose from 5 in 2017 to 102 in 2025. Industry’s share nearly tripled from 13% to 37%, making it the largest witness group, while academia’s share fell to 15%.
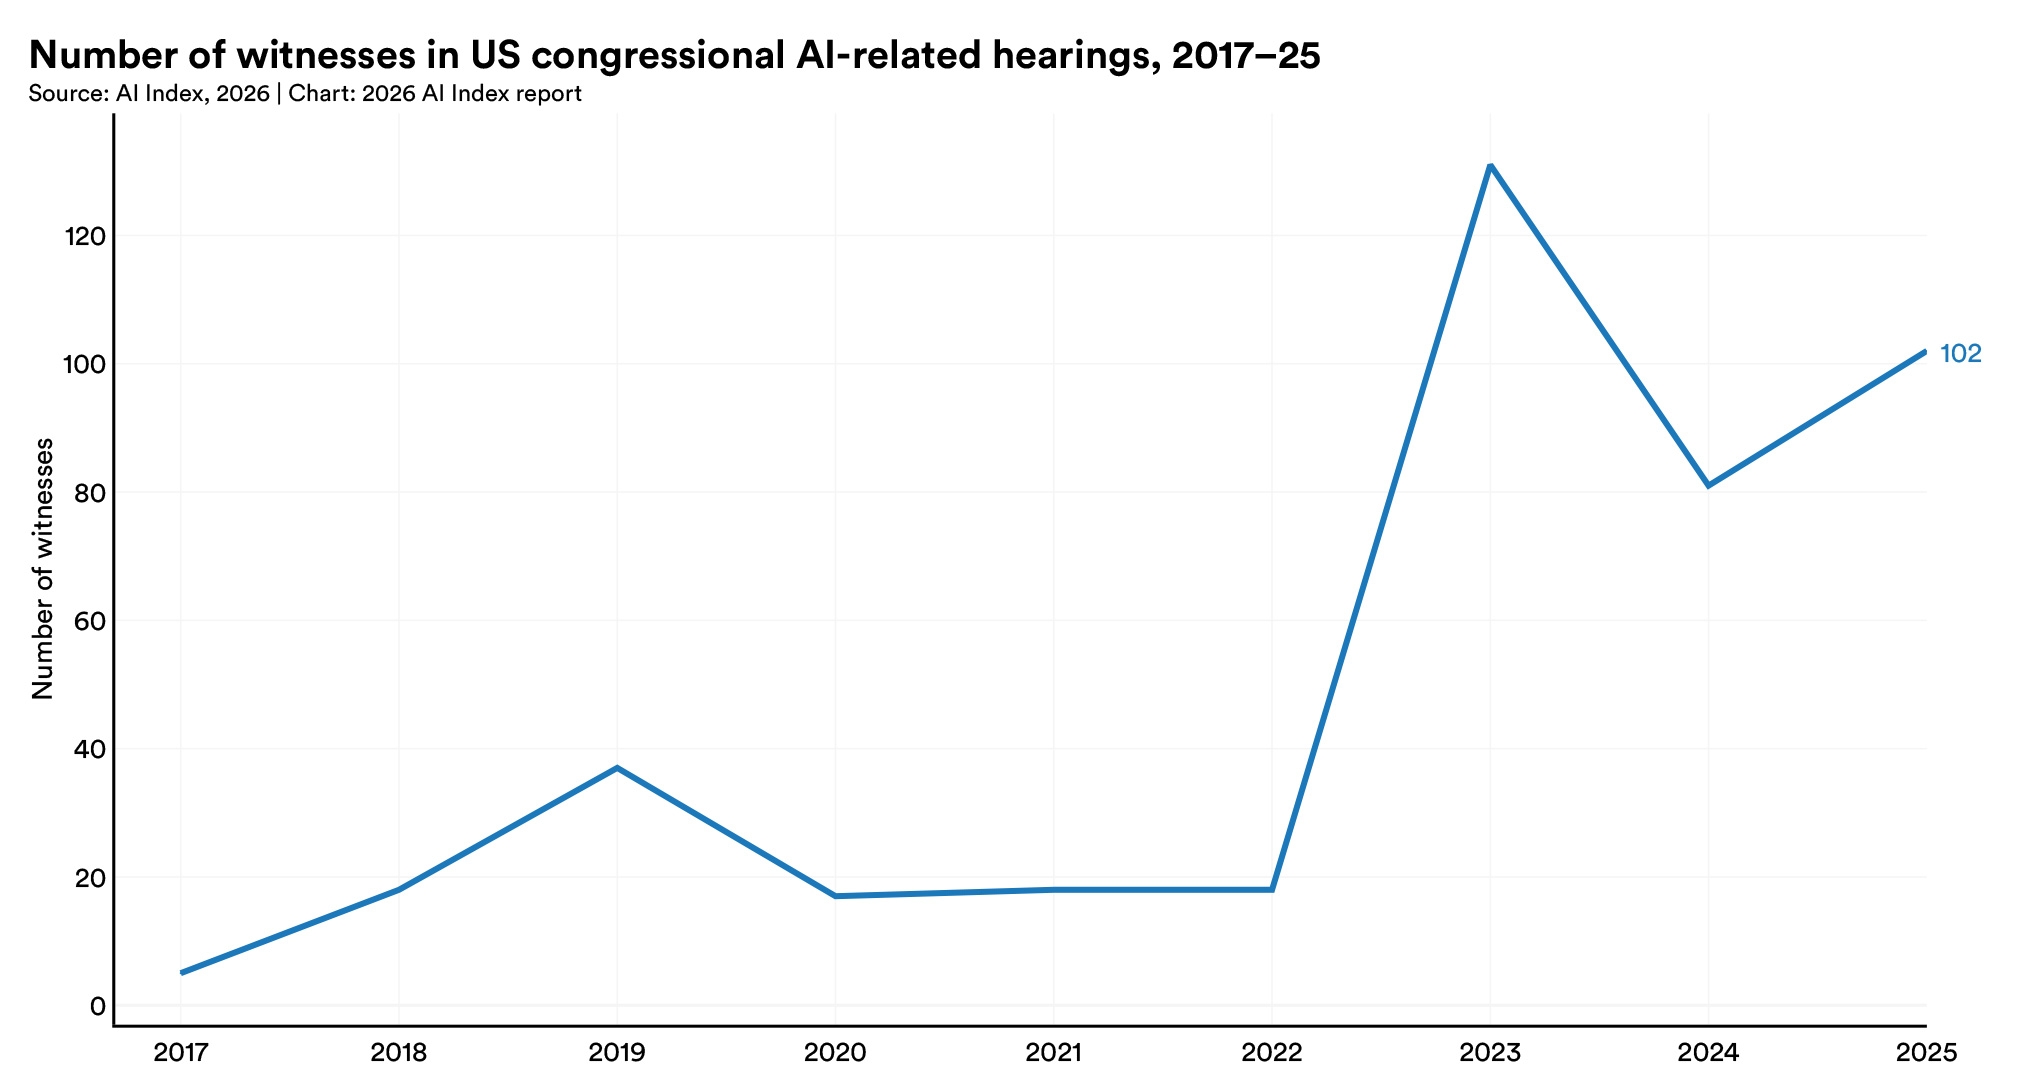
Line chart showing the number of witnesses in U.S. congressional AI-related hearings from 2017 to 2025. Witness counts rose gradually through 2019, remained low and stable from 2020 to 2022, then surged sharply in 2023 before declining in 2024 and rising again to 102 in 2025.

5. U.S. public investment in AI remains modest compared to private-sector spending.

Between 2013 and 2024, the United States invested approximately $20.4 billion in AI-related contracts and grants, against $285.9 billion in U.S. private investment in 2025 alone.
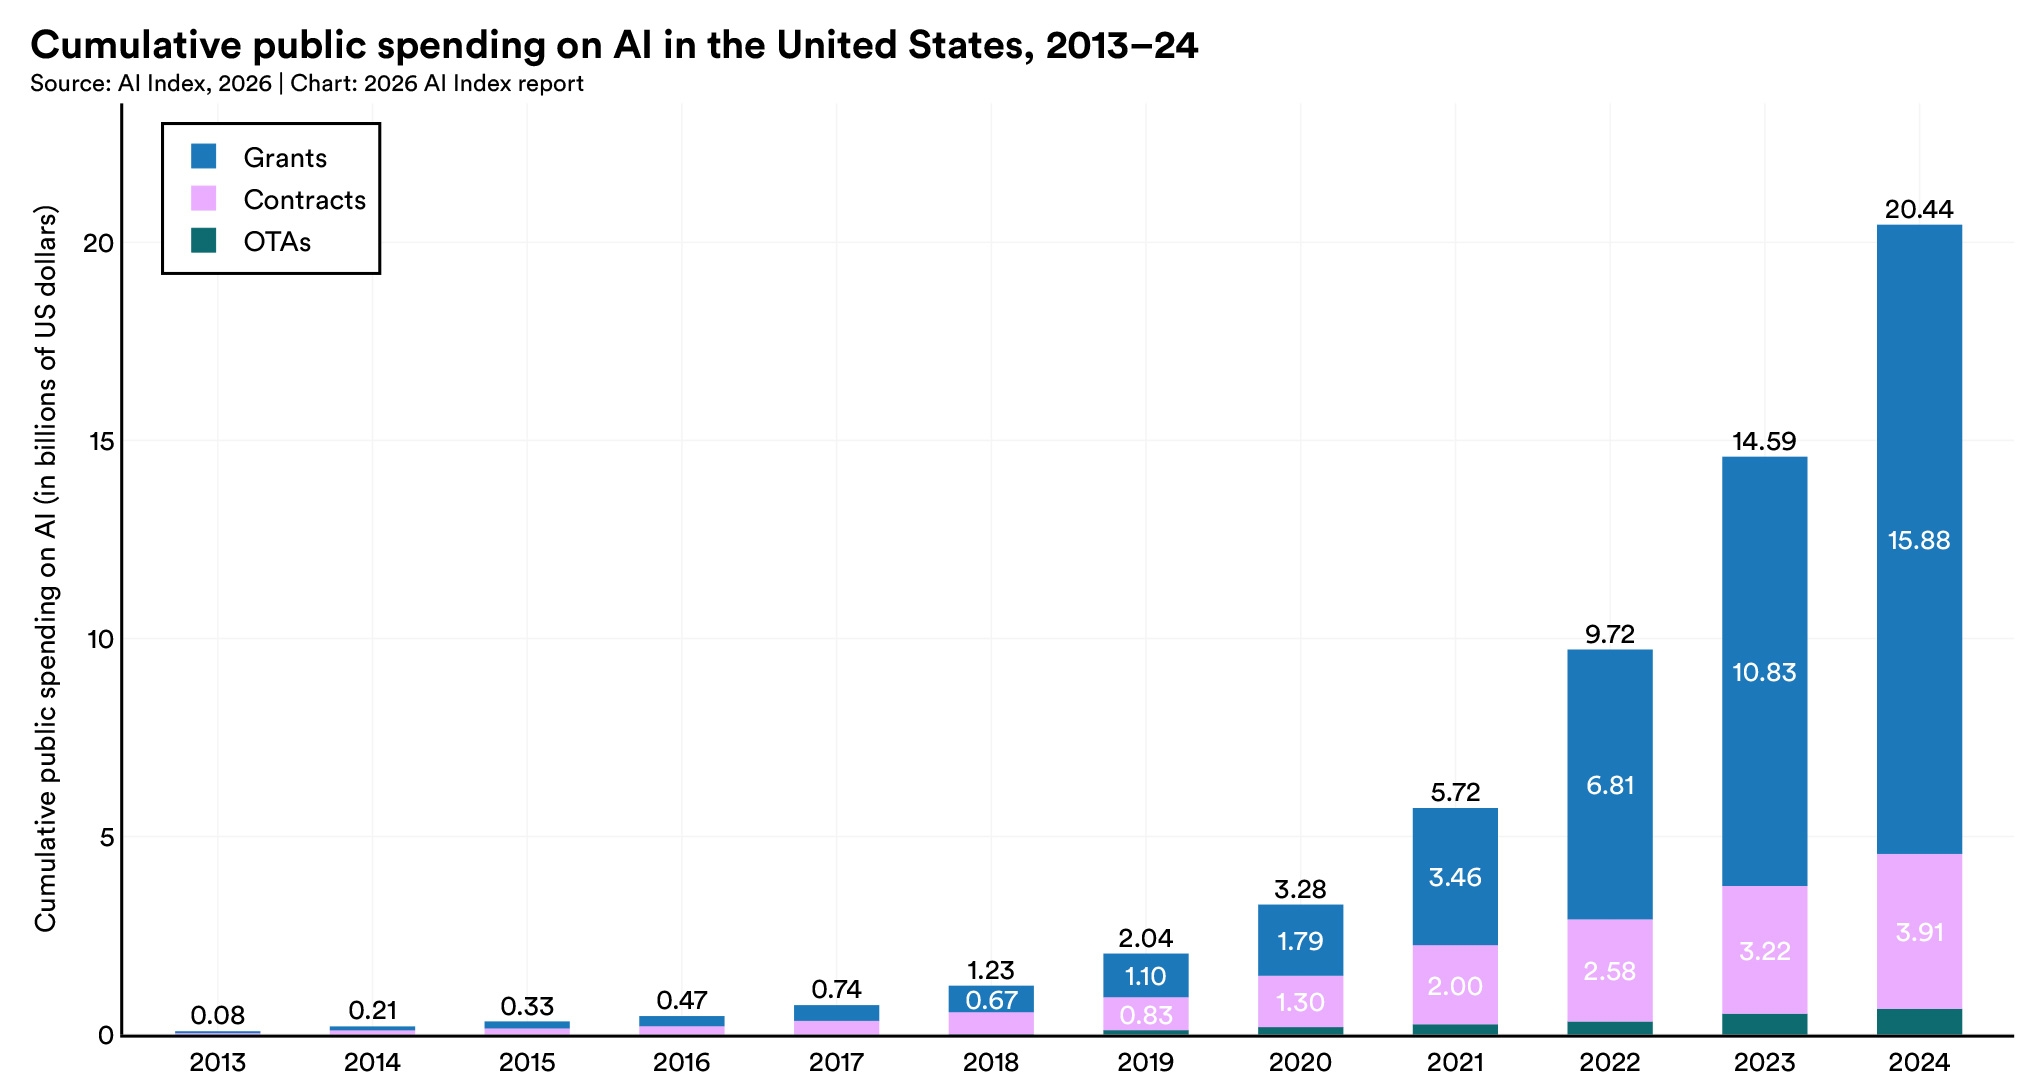
Stacked bar chart showing cumulative U.S. public AI spending from 2013 to 2024. Spending rises sharply after 2020, reaching over $20 billion in 2024, mostly through grants and contracts.

6. European AI public commitments reached approximately $3.7 billion in contracts over 2013–2024.

The United Kingdom accounted for $1.6 billion, followed by Germany with $505 million and France with $320 million. Recent spending is accelerating as well. In 2024 alone, the U.K. committed $454.4 million (28% of its decade total) and Germany committed $206.6 million (40% of its total).
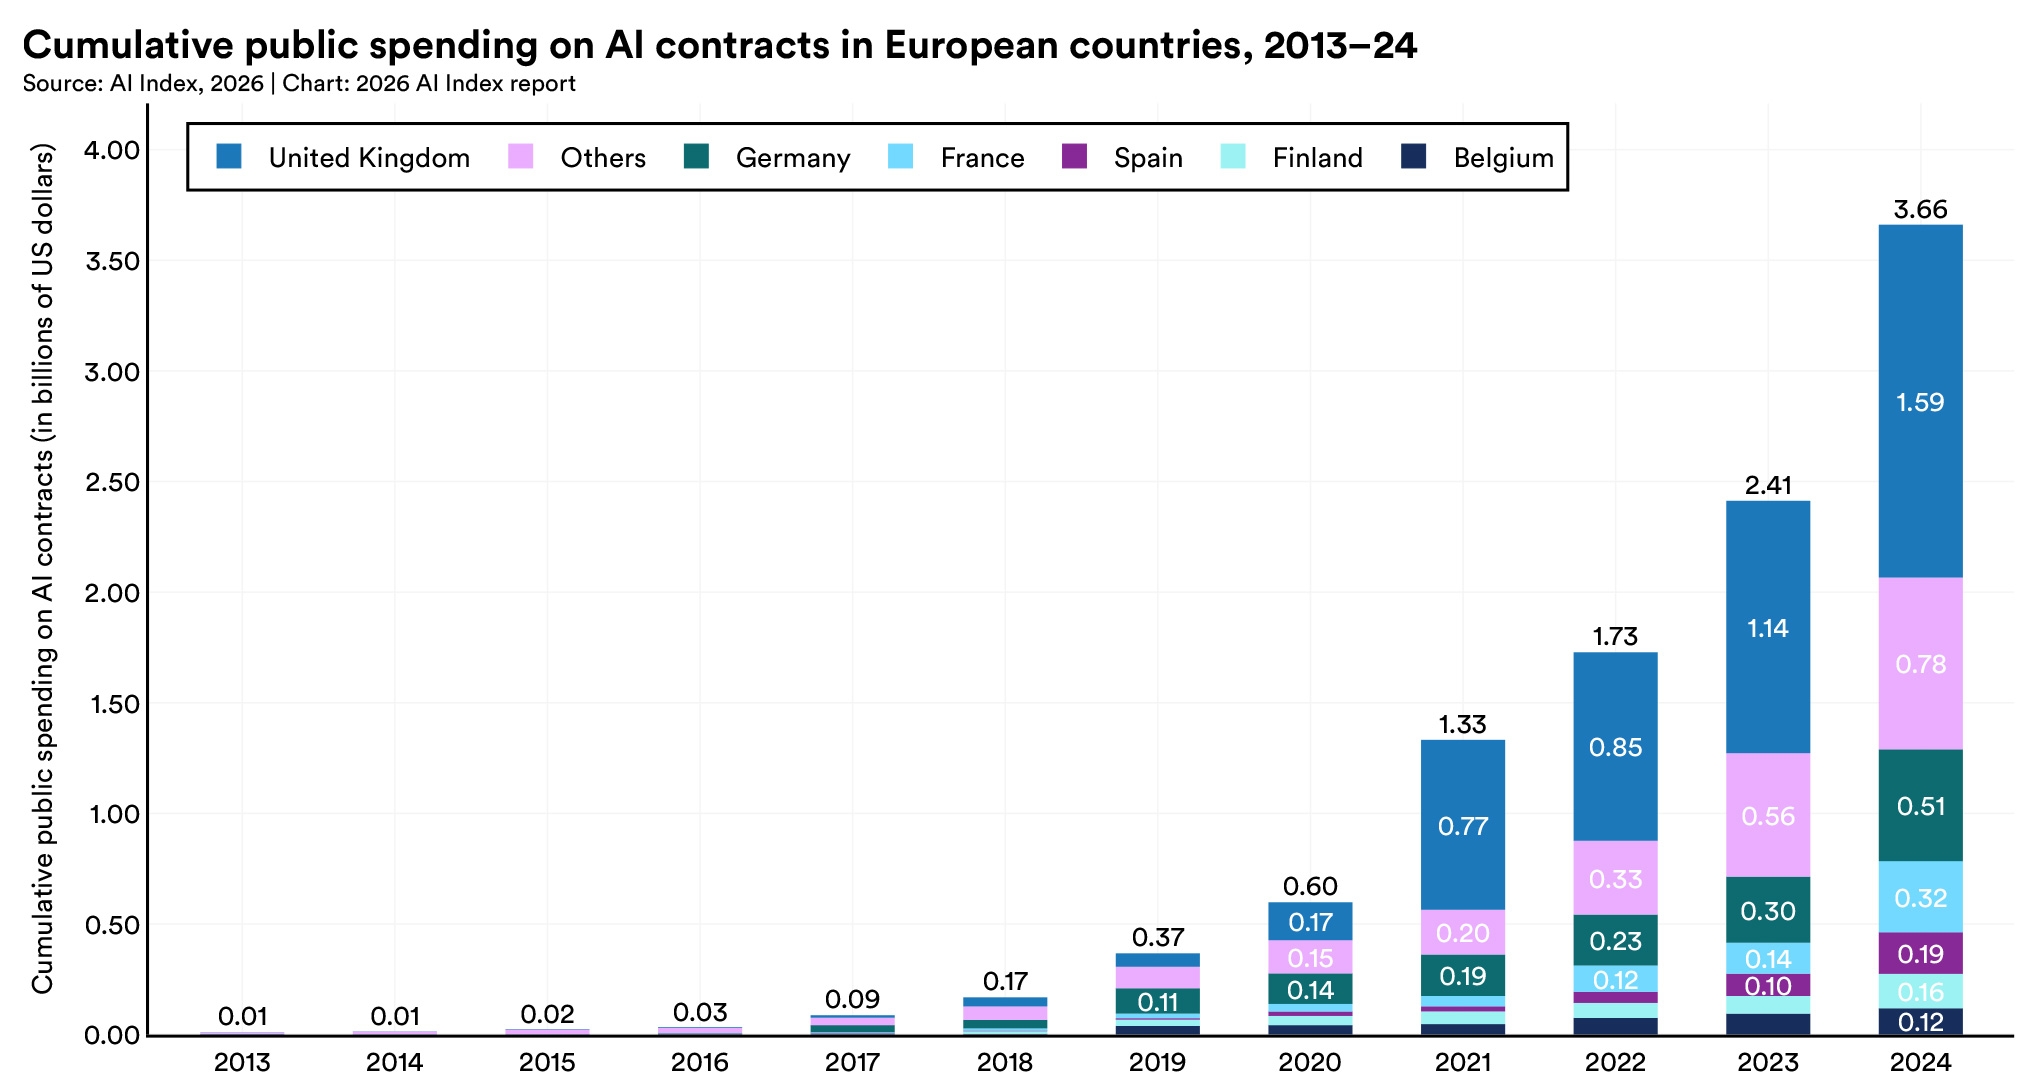
Stacked bar chart showing cumulative public spending on AI contracts in European countries from 2013 to 2024. Spending rises sharply after 2020, reaching $3.66 billion in 2024, led by the United Kingdom; Belgium has the lowest spending among the countries shown.

Support the AI Index in our mission to provide comprehensive, unbiased data on artificial intelligence worldwide. Your support sustains rigorous research, data collection, and analysis that informs policymakers, researchers, journalists, and business leaders—ensuring transparent AI metrics guide humanity toward a better future.

Make a Gift to AI Index

Policy and Governance | The 2026 AI Index Report | Stanford HAI