Public Opinion | The 2026 AI Index Report | Stanford HAI
Stanford
University
  • Stanford Home
  • Maps & Directions
  • Search Stanford
  • Emergency Info
  • Terms of Use
  • Privacy
  • Copyright
  • Trademarks
  • Non-Discrimination
  • Accessibility
© Stanford University.  Stanford, California 94305.
Skip to content
  • About

    • About
    • People
    • Get Involved with HAI
    • Support HAI
    • Subscribe to Email
  • Research

    • Research
    • Research Programs
    • Grants
    • Marlowe (opens in new tab)
    • Student Affinity Groups
    • Centers & Labs
    • Research Publications
    • Research Partners
  • Education

    • Education
    • Executive and Professional Education
    • Government and Policymakers
    • K-12
    • Stanford Students
  • Policy

    • Policy
    • Policy Publications
    • Policymaker Education
    • Student Opportunities
  • AI Index

    • AI Index
    • AI Index Report
    • Global Vibrancy Tool
    • People
  • News
  • Events
  • Industry
  • Centers & Labs
Navigate
  • About
  • Events
  • AI Glossary
  • Careers
  • Search
Participate
  • Get Involved
  • Support HAI
  • Contact Us

Stay Up To Date

Get the latest news, advances in research, policy work, and education program updates from HAI in your inbox weekly.

Sign Up For Latest News

09

Public Opinion

Communications, Media
Workforce, Labor

Drawing on global survey data, this chapter captures public sentiment toward AI, from  trust levels, transparency, and regulation to employment and personal relationships. 

Download Full Chapter

All Chapters

  • Back to Overview
  • 01Research and Development
  • 02Technical Performance
  • 03Responsible AI
  • 04Economy
  • 05Science
  • 06Medicine
  • 07Education
  • 08Policy and Governance
  • 09Public Opinion

1. AI optimism is rising, but so is anxiety.

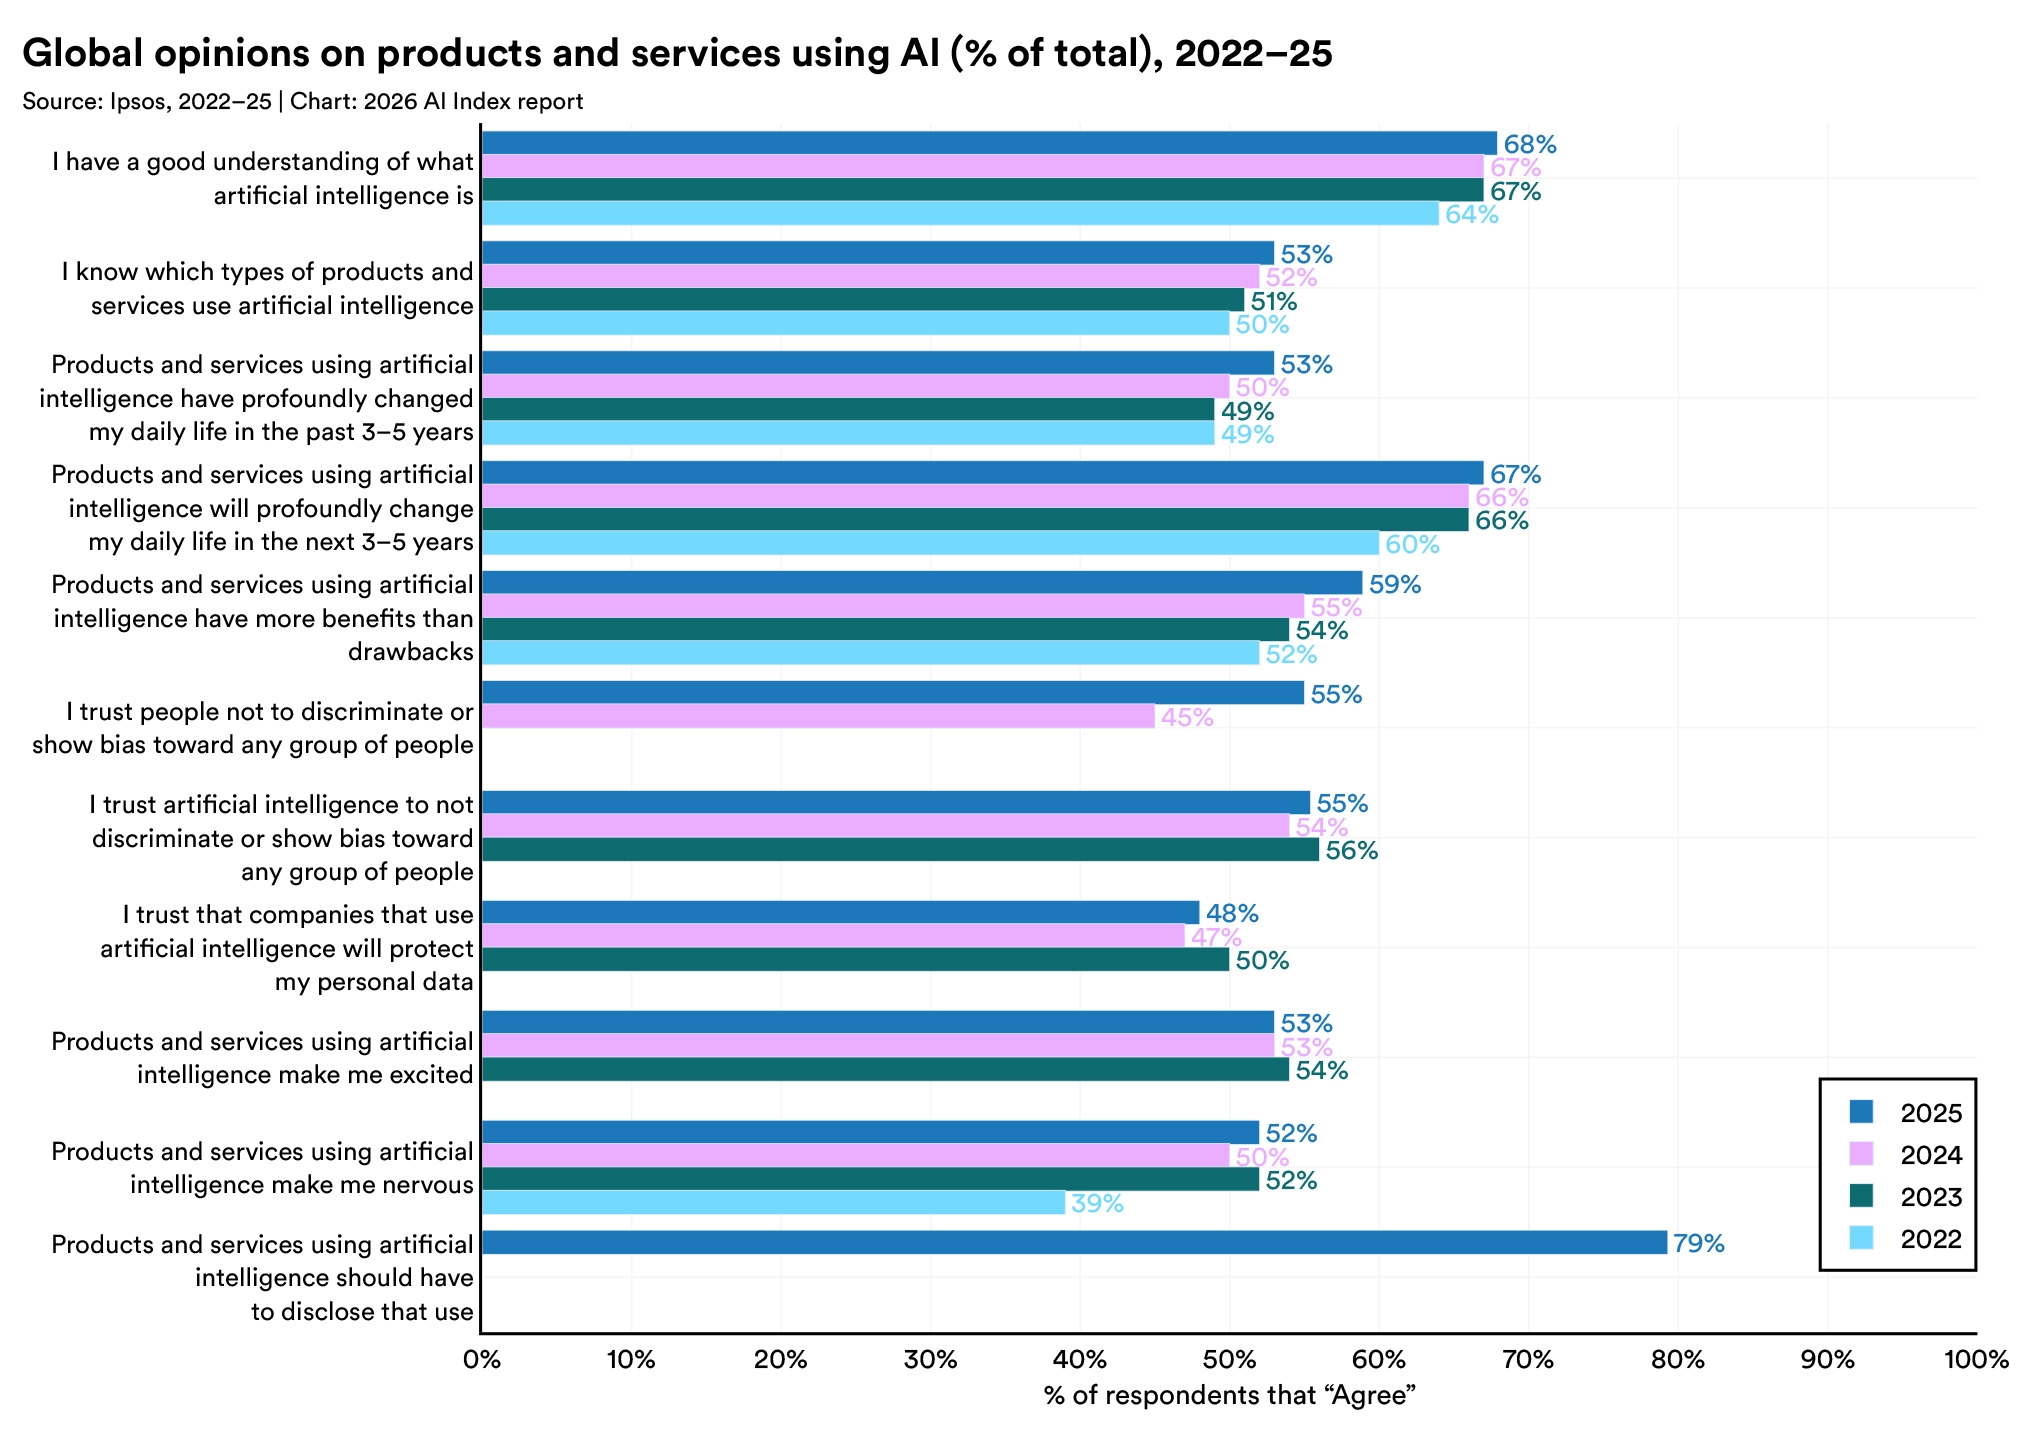
Globally, the share of respondents who say AI products and services offer more benefits than drawbacks rose from 55% in 2024 to 59% in 2025, even as the share saying these products make them nervous increased to 52%.

Horizontal bar chart titled "Global opinions on products and services using AI, 2022–25," showing levels of agreement with various statements regarding AI understanding, trust, excitement, concern, and the demand for usage disclosure over this period.

2. Southeast Asian countries remain among the world’s most optimistic about AI.

In Malaysia, Thailand, Indonesia, and Singapore, more than 80% of respondents say AI will profoundly change their lives in the next 3-5 years, with Malaysia posting the largest increase from 2024.
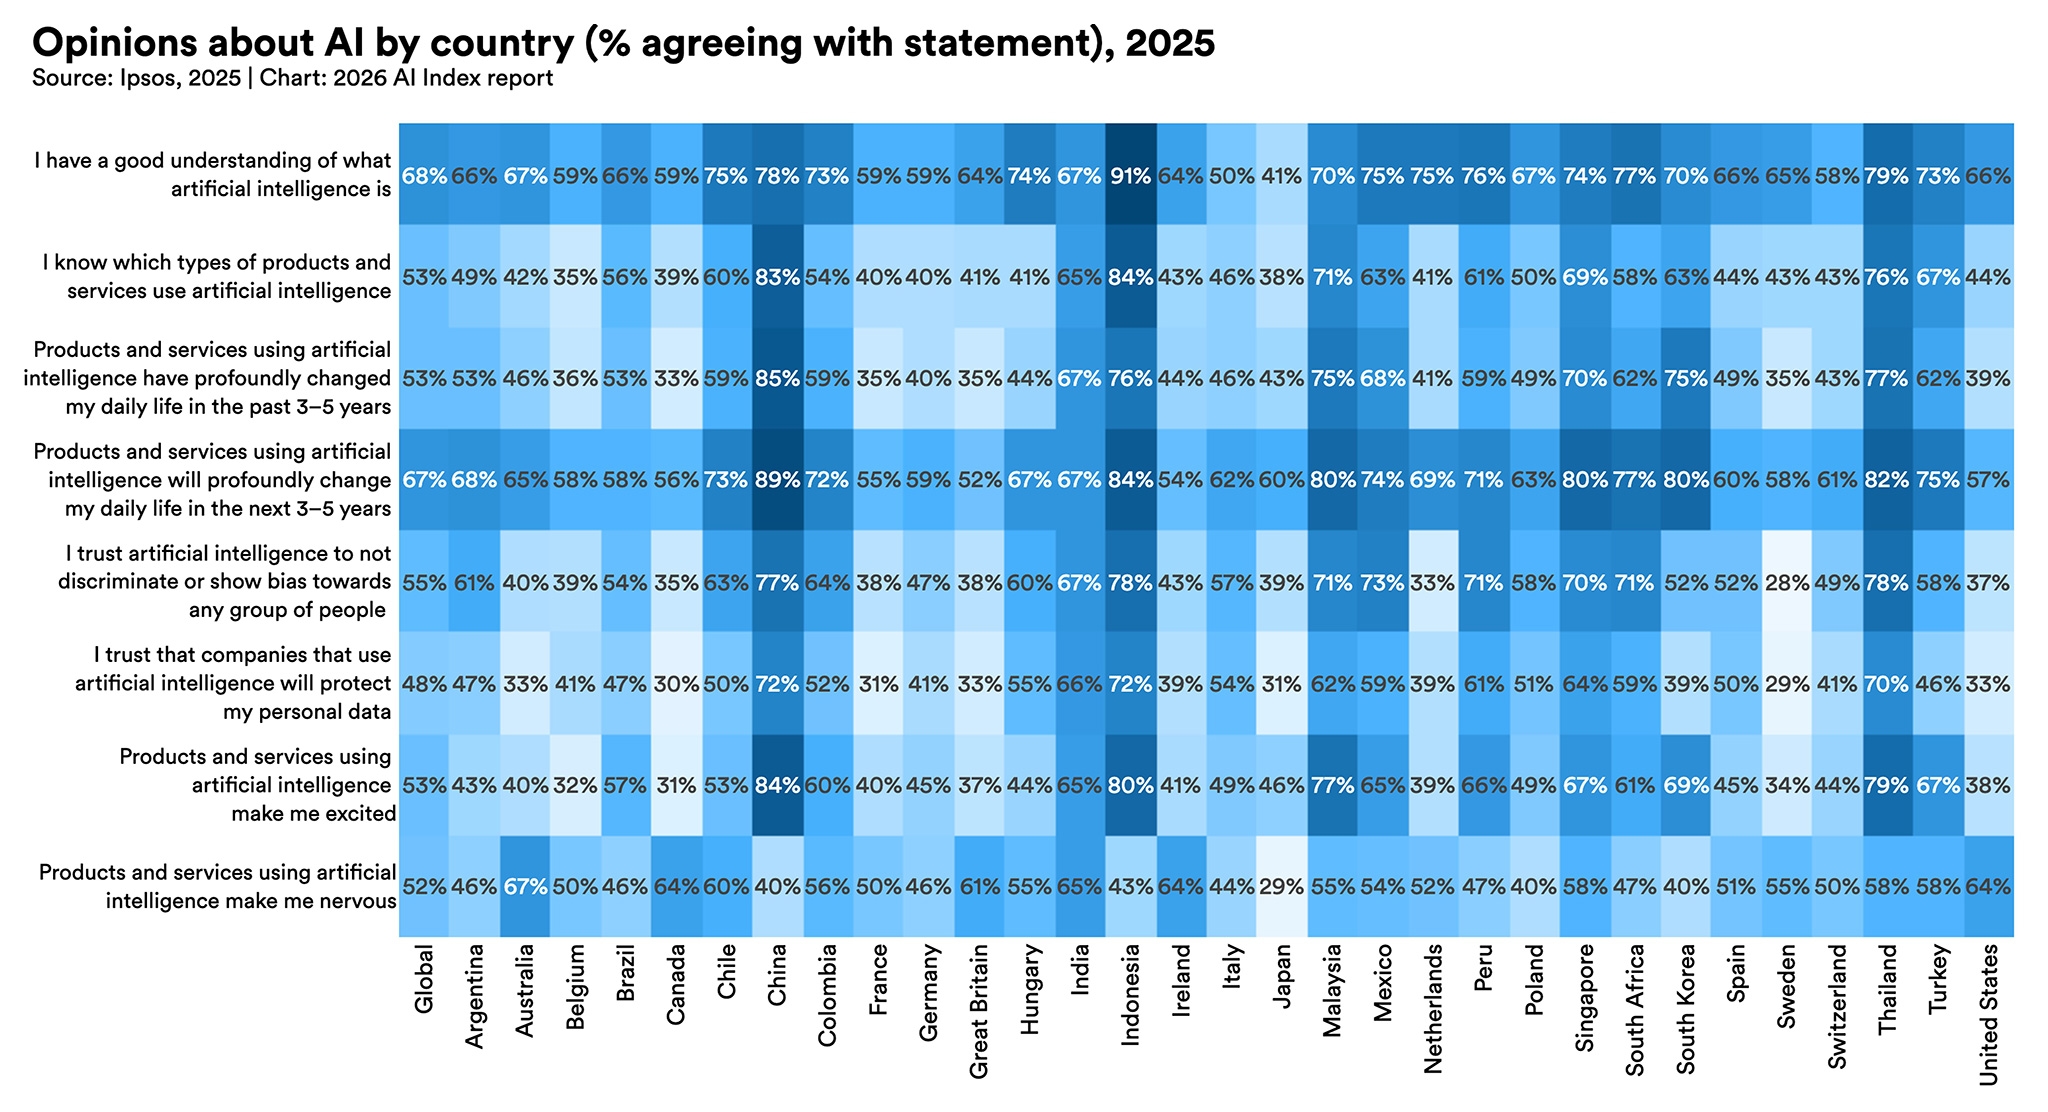
Heatmap chart titled "Opinions about AI by country (% agreeing with statement), 2025" from the 2026 AI Index report. The chart tracks agreement rates across over 30 countries for 8 statements regarding AI understanding, impact, trust, excitement, and nervousness. Darker blue cells indicate higher agreement. Notable trends show very high agreement and optimism in countries like Indonesia and China, while Japan consistently shows some of the lowest agreement rates.

3. India saw the sharpest rise in AI nervousness of any country surveyed.

Between 2024 and 2025, India registered the sharpest rise in concern around AI usage (+14 percentage points) with only a modest increase in excitement (+2).
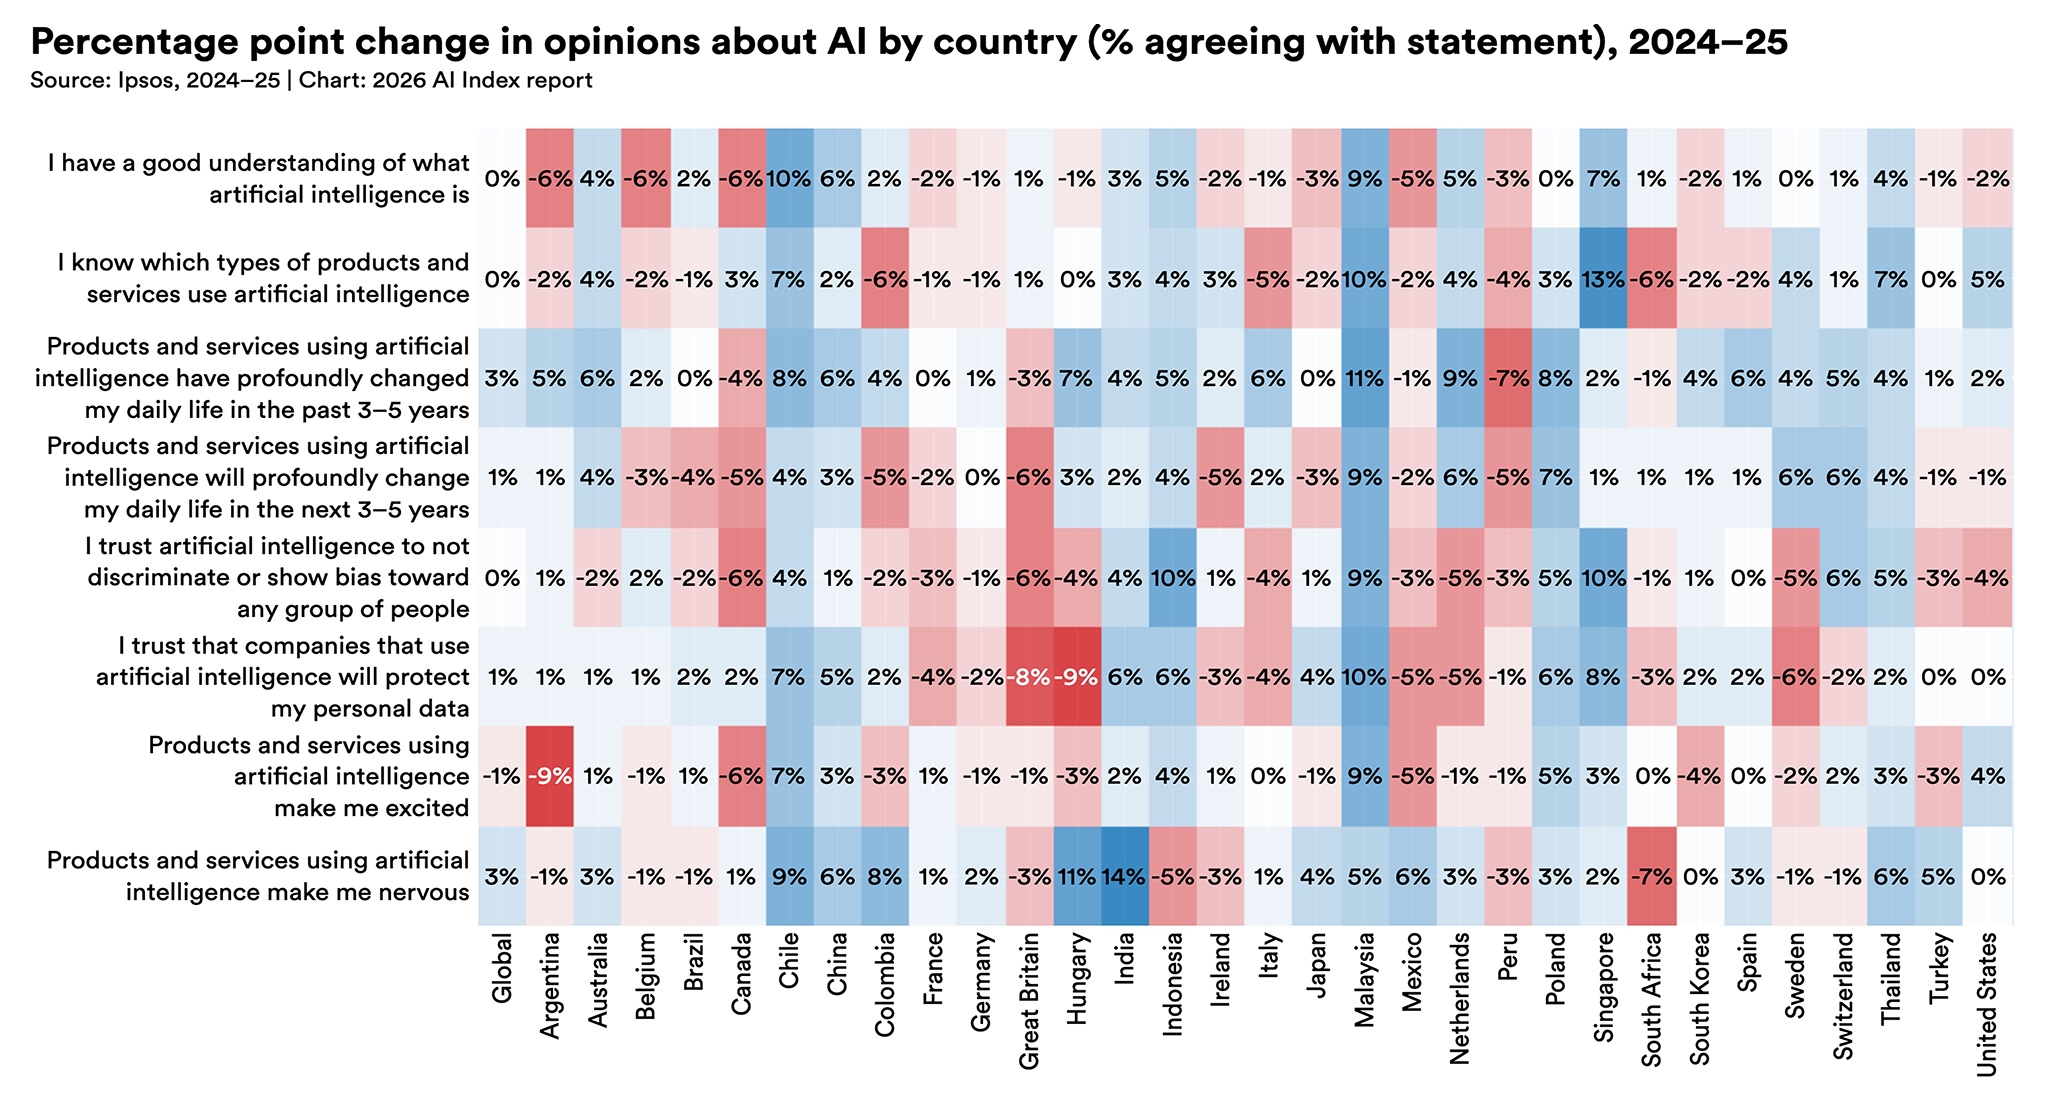
Heatmap showing percentage-point changes in AI opinions by country from 2024 to 2025. Blue cells indicate increases in agreement and red cells indicate decreases across eight AI-related statements. Changes vary widely by country; Indonesia shows several of the largest increases, while some countries show notable declines in trust, excitement, and perceptions of AI’s benefits.

4. Workplace AI usage is higher in several emerging economies than in many advanced ones.

In 2025, 58% of employees globally reported using AI at work on a semiregular or regular basis, but in India, China, Nigeria, the United Arab Emirates, Egypt, and Saudi Arabia, the share exceeded 80%.
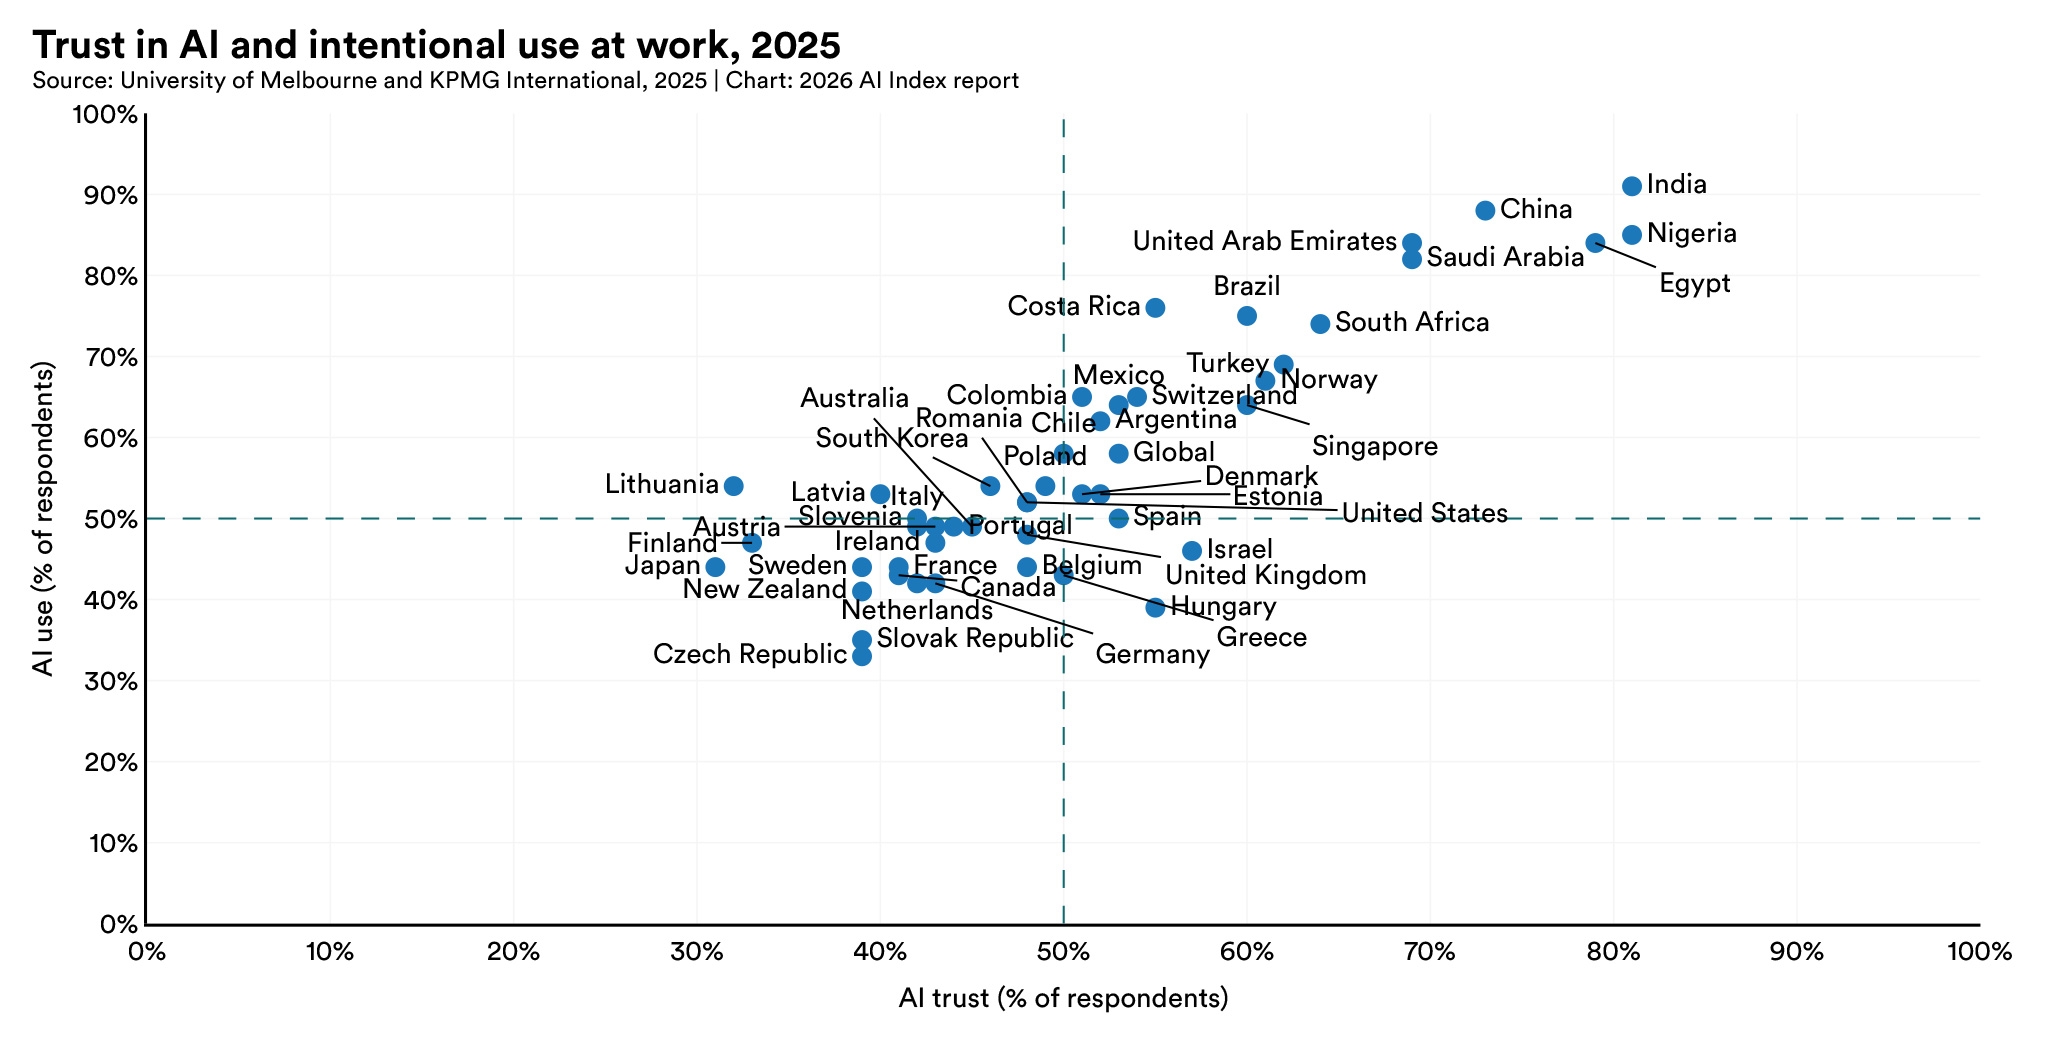
Scatter plot titled "Trust in AI and intentional use at work, 2025,” comparing AI trust with the share of workers intentionally using AI. India and Nigeria rank highest on both measures, while European countries including the Czech Republic, Slovakia, and Germany report comparatively low AI trust and workplace use.

5. AI experts and the U.S. public have very different perspectives on AI's future, except on elections and personal relationships.

On how people do their jobs, 73% of experts expect a positive impact compared to just 23% of the public, a 50-point gap. Similar divides appear for the economy (69% vs. 21%) and medical care (84% vs. 44%).
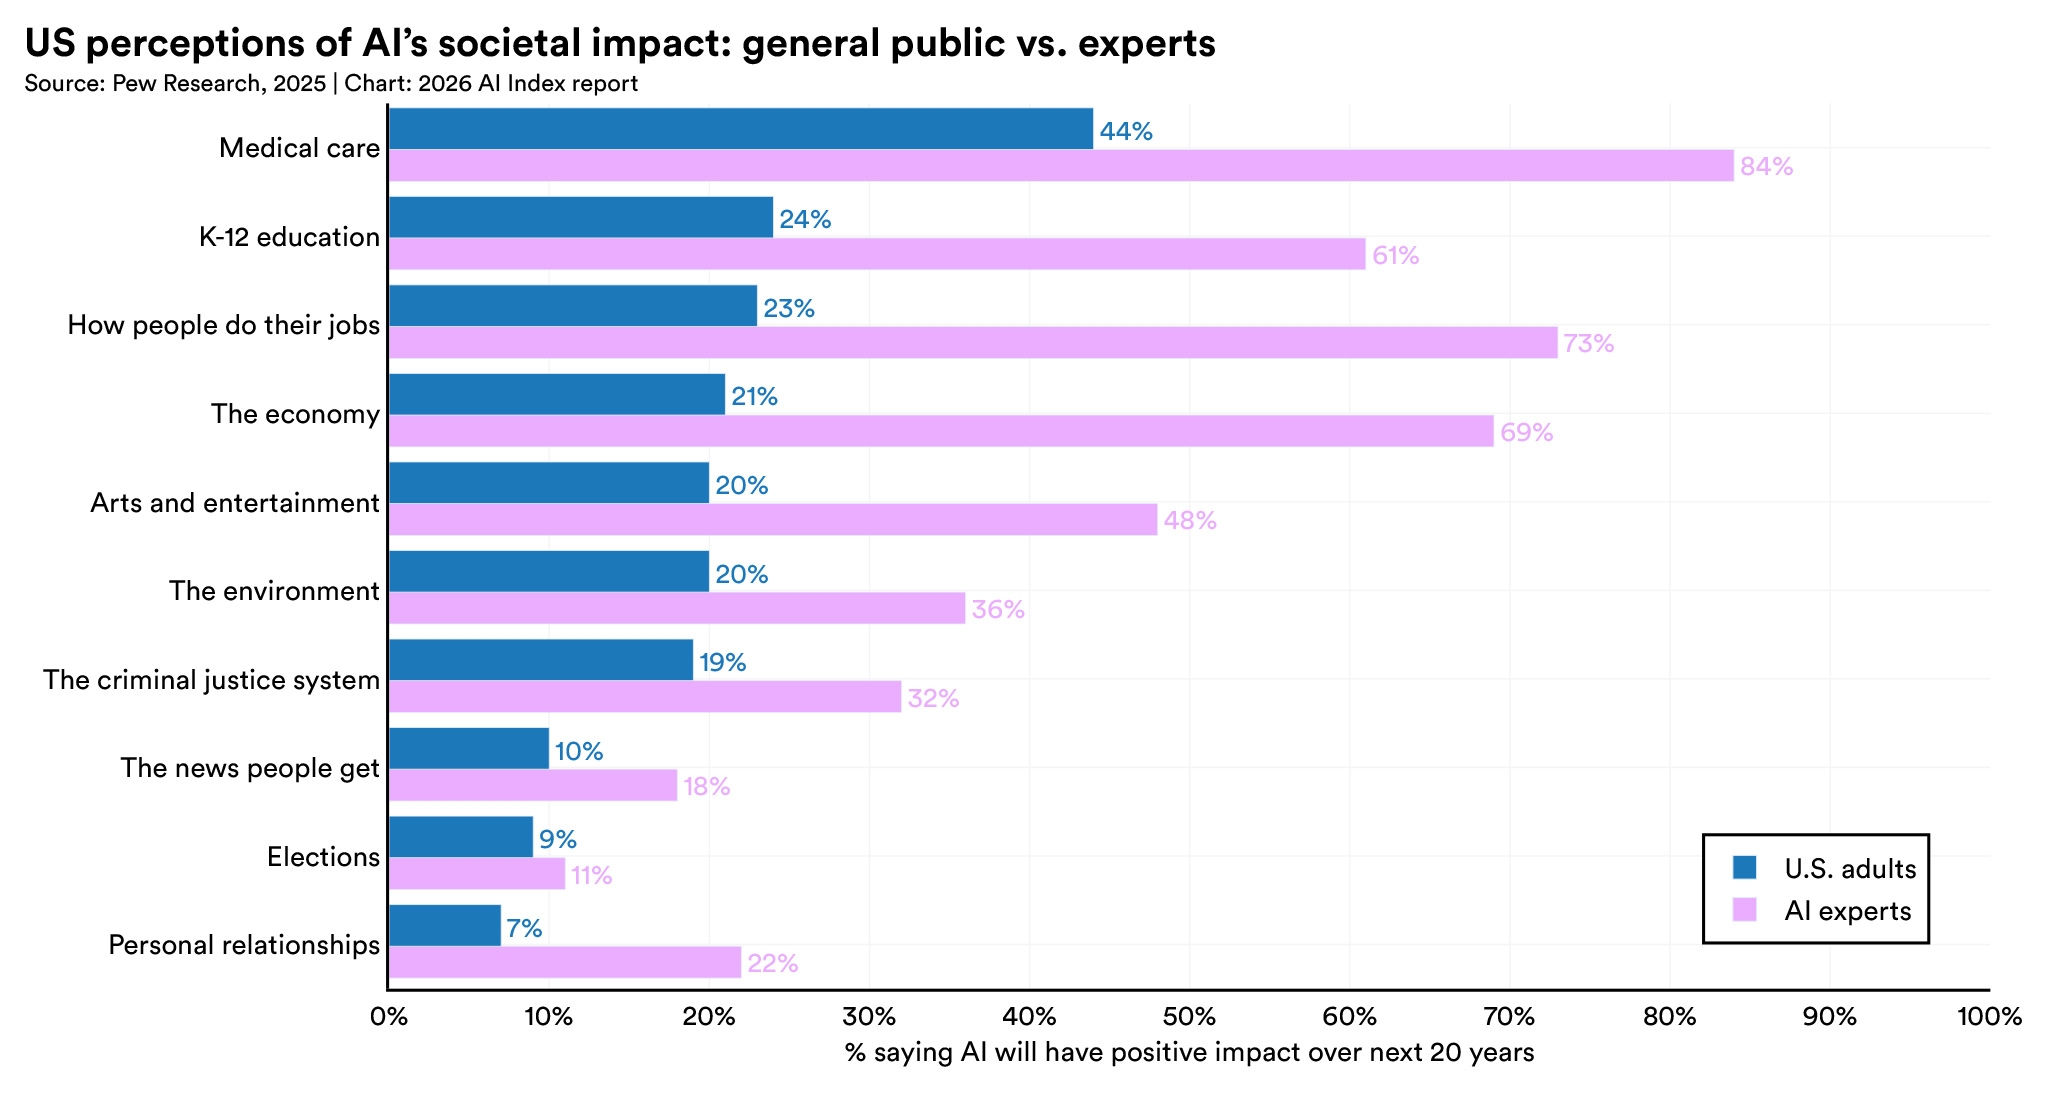
Horizontal bar chart titled "US perceptions of AI's societal impact: general public vs. experts." It compares U.S. adults and AI experts on their outlook for AI's positive societal impact over the next 20 years. Experts are significantly more optimistic than the general public across all categories, especially in medical care (84% vs. 44%) and K-12 education (61% vs. 24%). Both groups agree AI will impact jobs and the economy positively, but experts foresee a much larger positive impact in nearly every area.

6. Nearly two-thirds of Americans (64%) expect AI to lead to fewer jobs over the next 20 years, while only 5% expect more.

Experts were less pessimistic (39% fewer, 19% more) but forecast far faster adoption, expecting generative AI to assist 18% of U.S. work hours by 2030 versus the public's estimate of 10%.
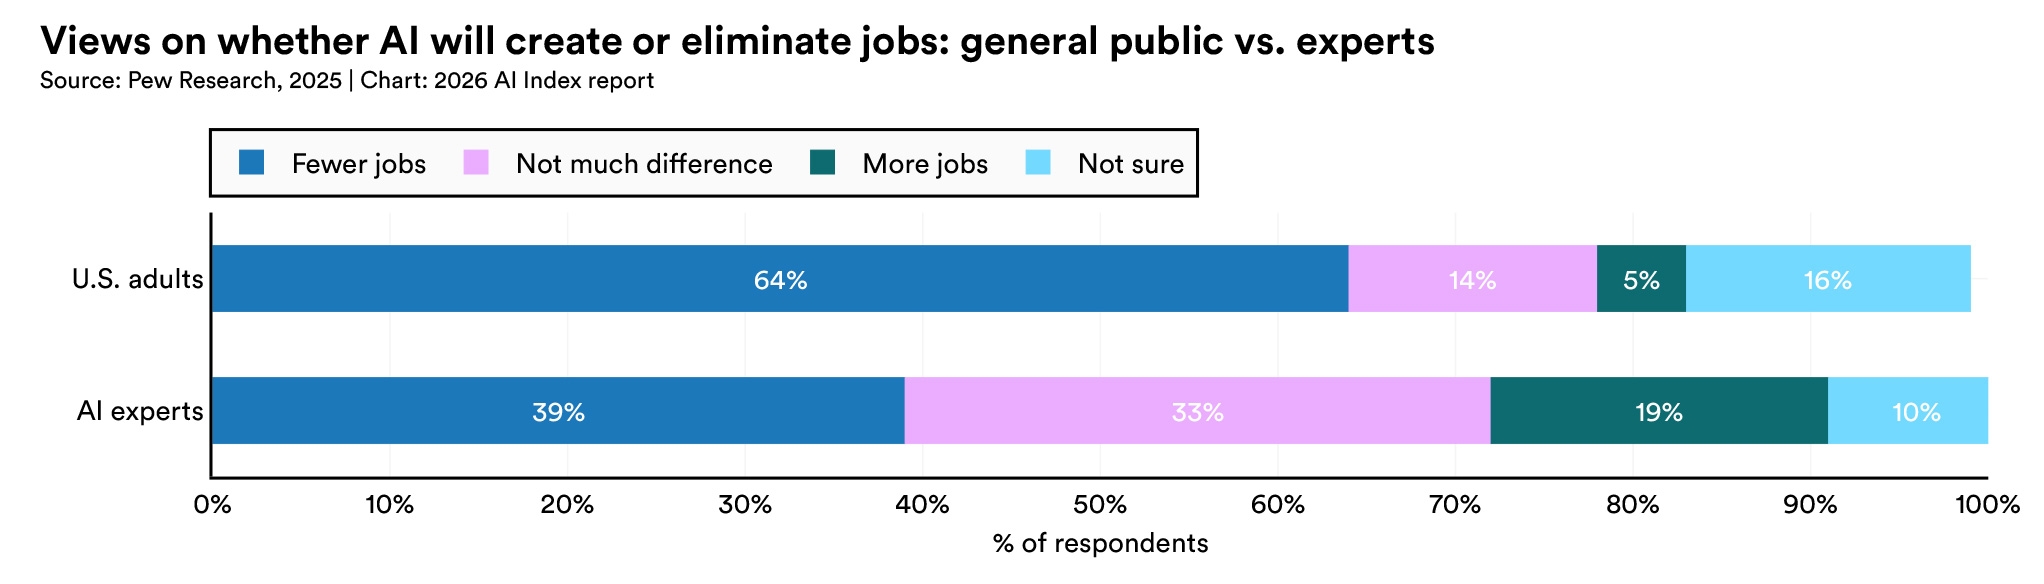
Bar chart titled "Views on whether AI will create or eliminate jobs: general public vs. experts." It presents differing opinions on AI's job impact. U.S. adults predominantly expect job losses (64%), whereas AI experts are more divided, with a substantial portion anticipating more jobs (19%) or no significant change (33%). Experts show a considerably more optimistic outlook regarding AI's job creation potential than the general public.

7. AI companionship is still niche, and global views vary widely.

More than half of respondents worldwide (52%) reported some excitement about using AI for companionship, compared with just 42% in the United States. Experts forecast that 10% of U.S. adults will use an AI companion daily by 2027, rising to 30% by 2040.
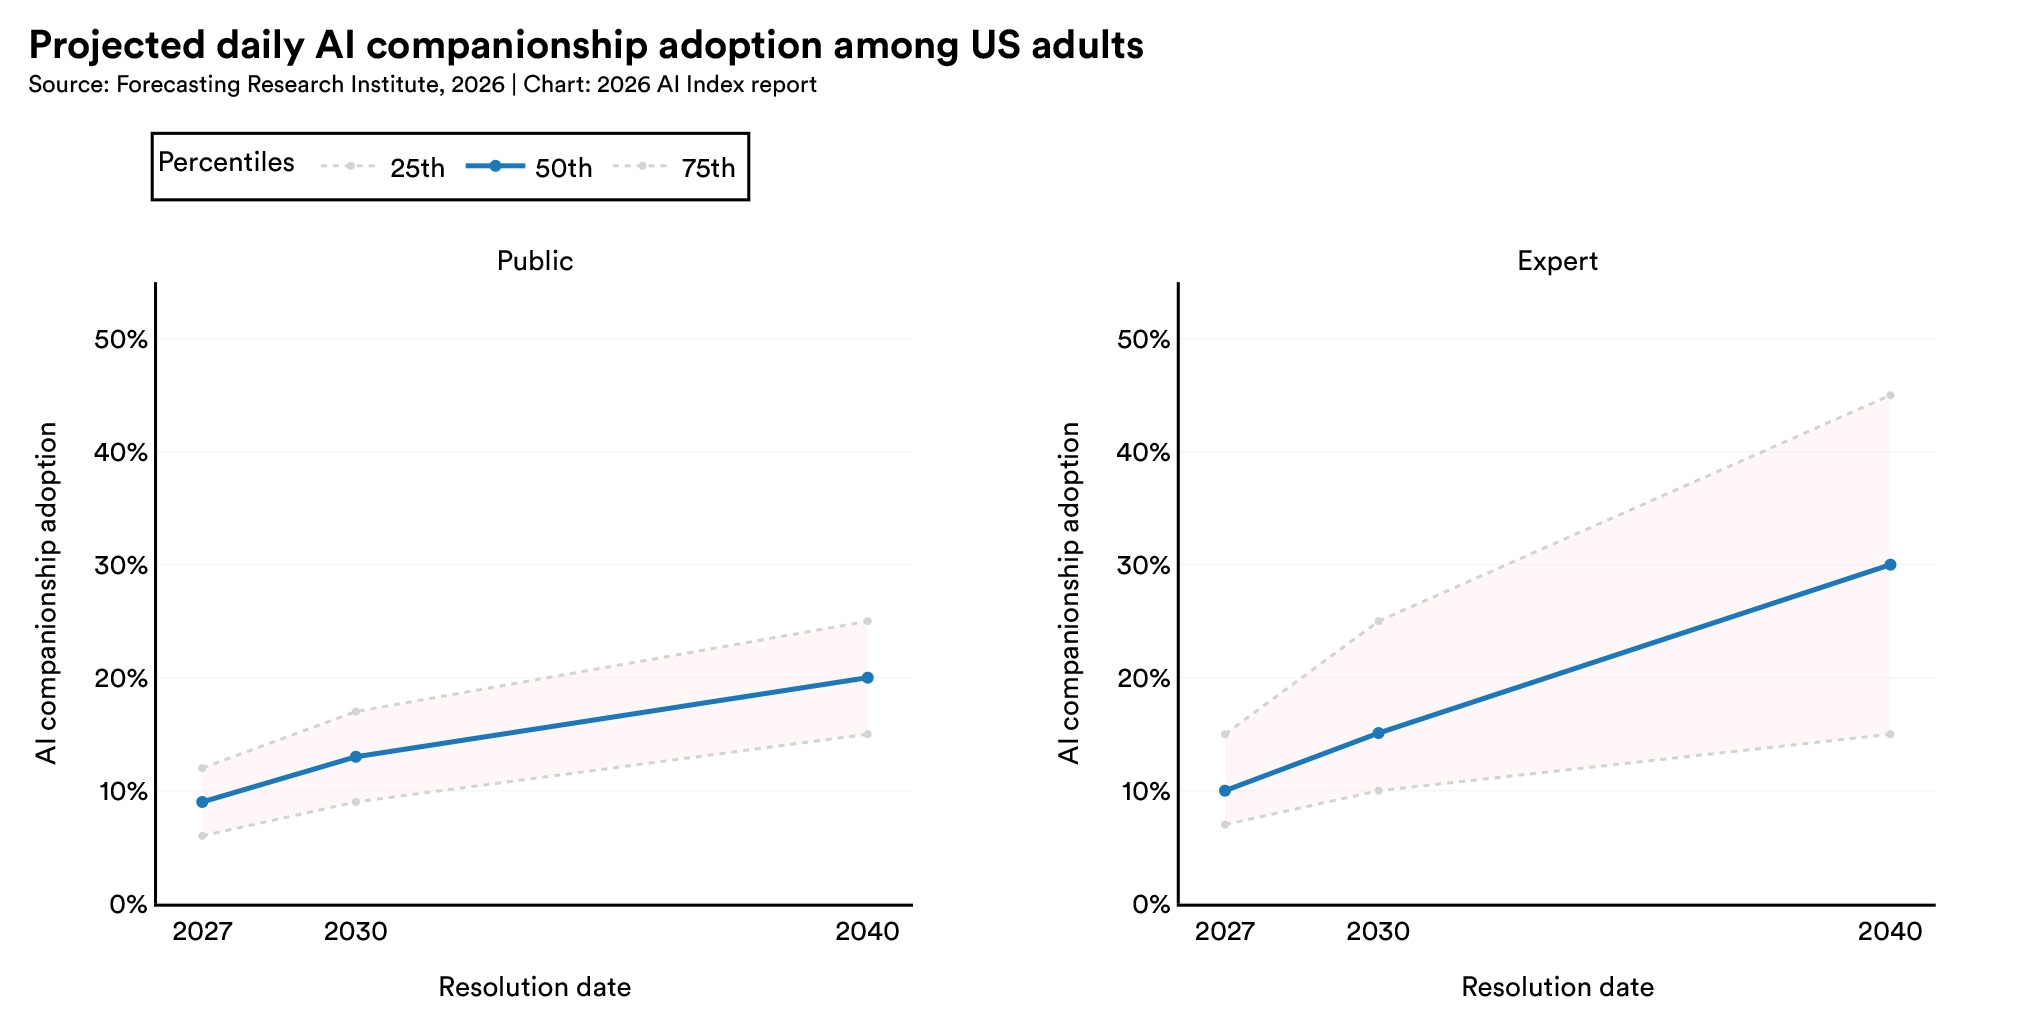
Line graphs titled "Projected daily AI companionship adoption among US adults," showing projections for the public and experts from 2027 to 2040. Both groups show increasing adoption over time, with experts predicting higher adoption rates and a broader range of possibilities than the general public.

8. The United States reported the lowest trust in its own government to regulate AI responsibly of any country surveyed, at 31%.

The global average was 54%, with Southeast Asian countries leading (Singapore 81%, Indonesia 76%).
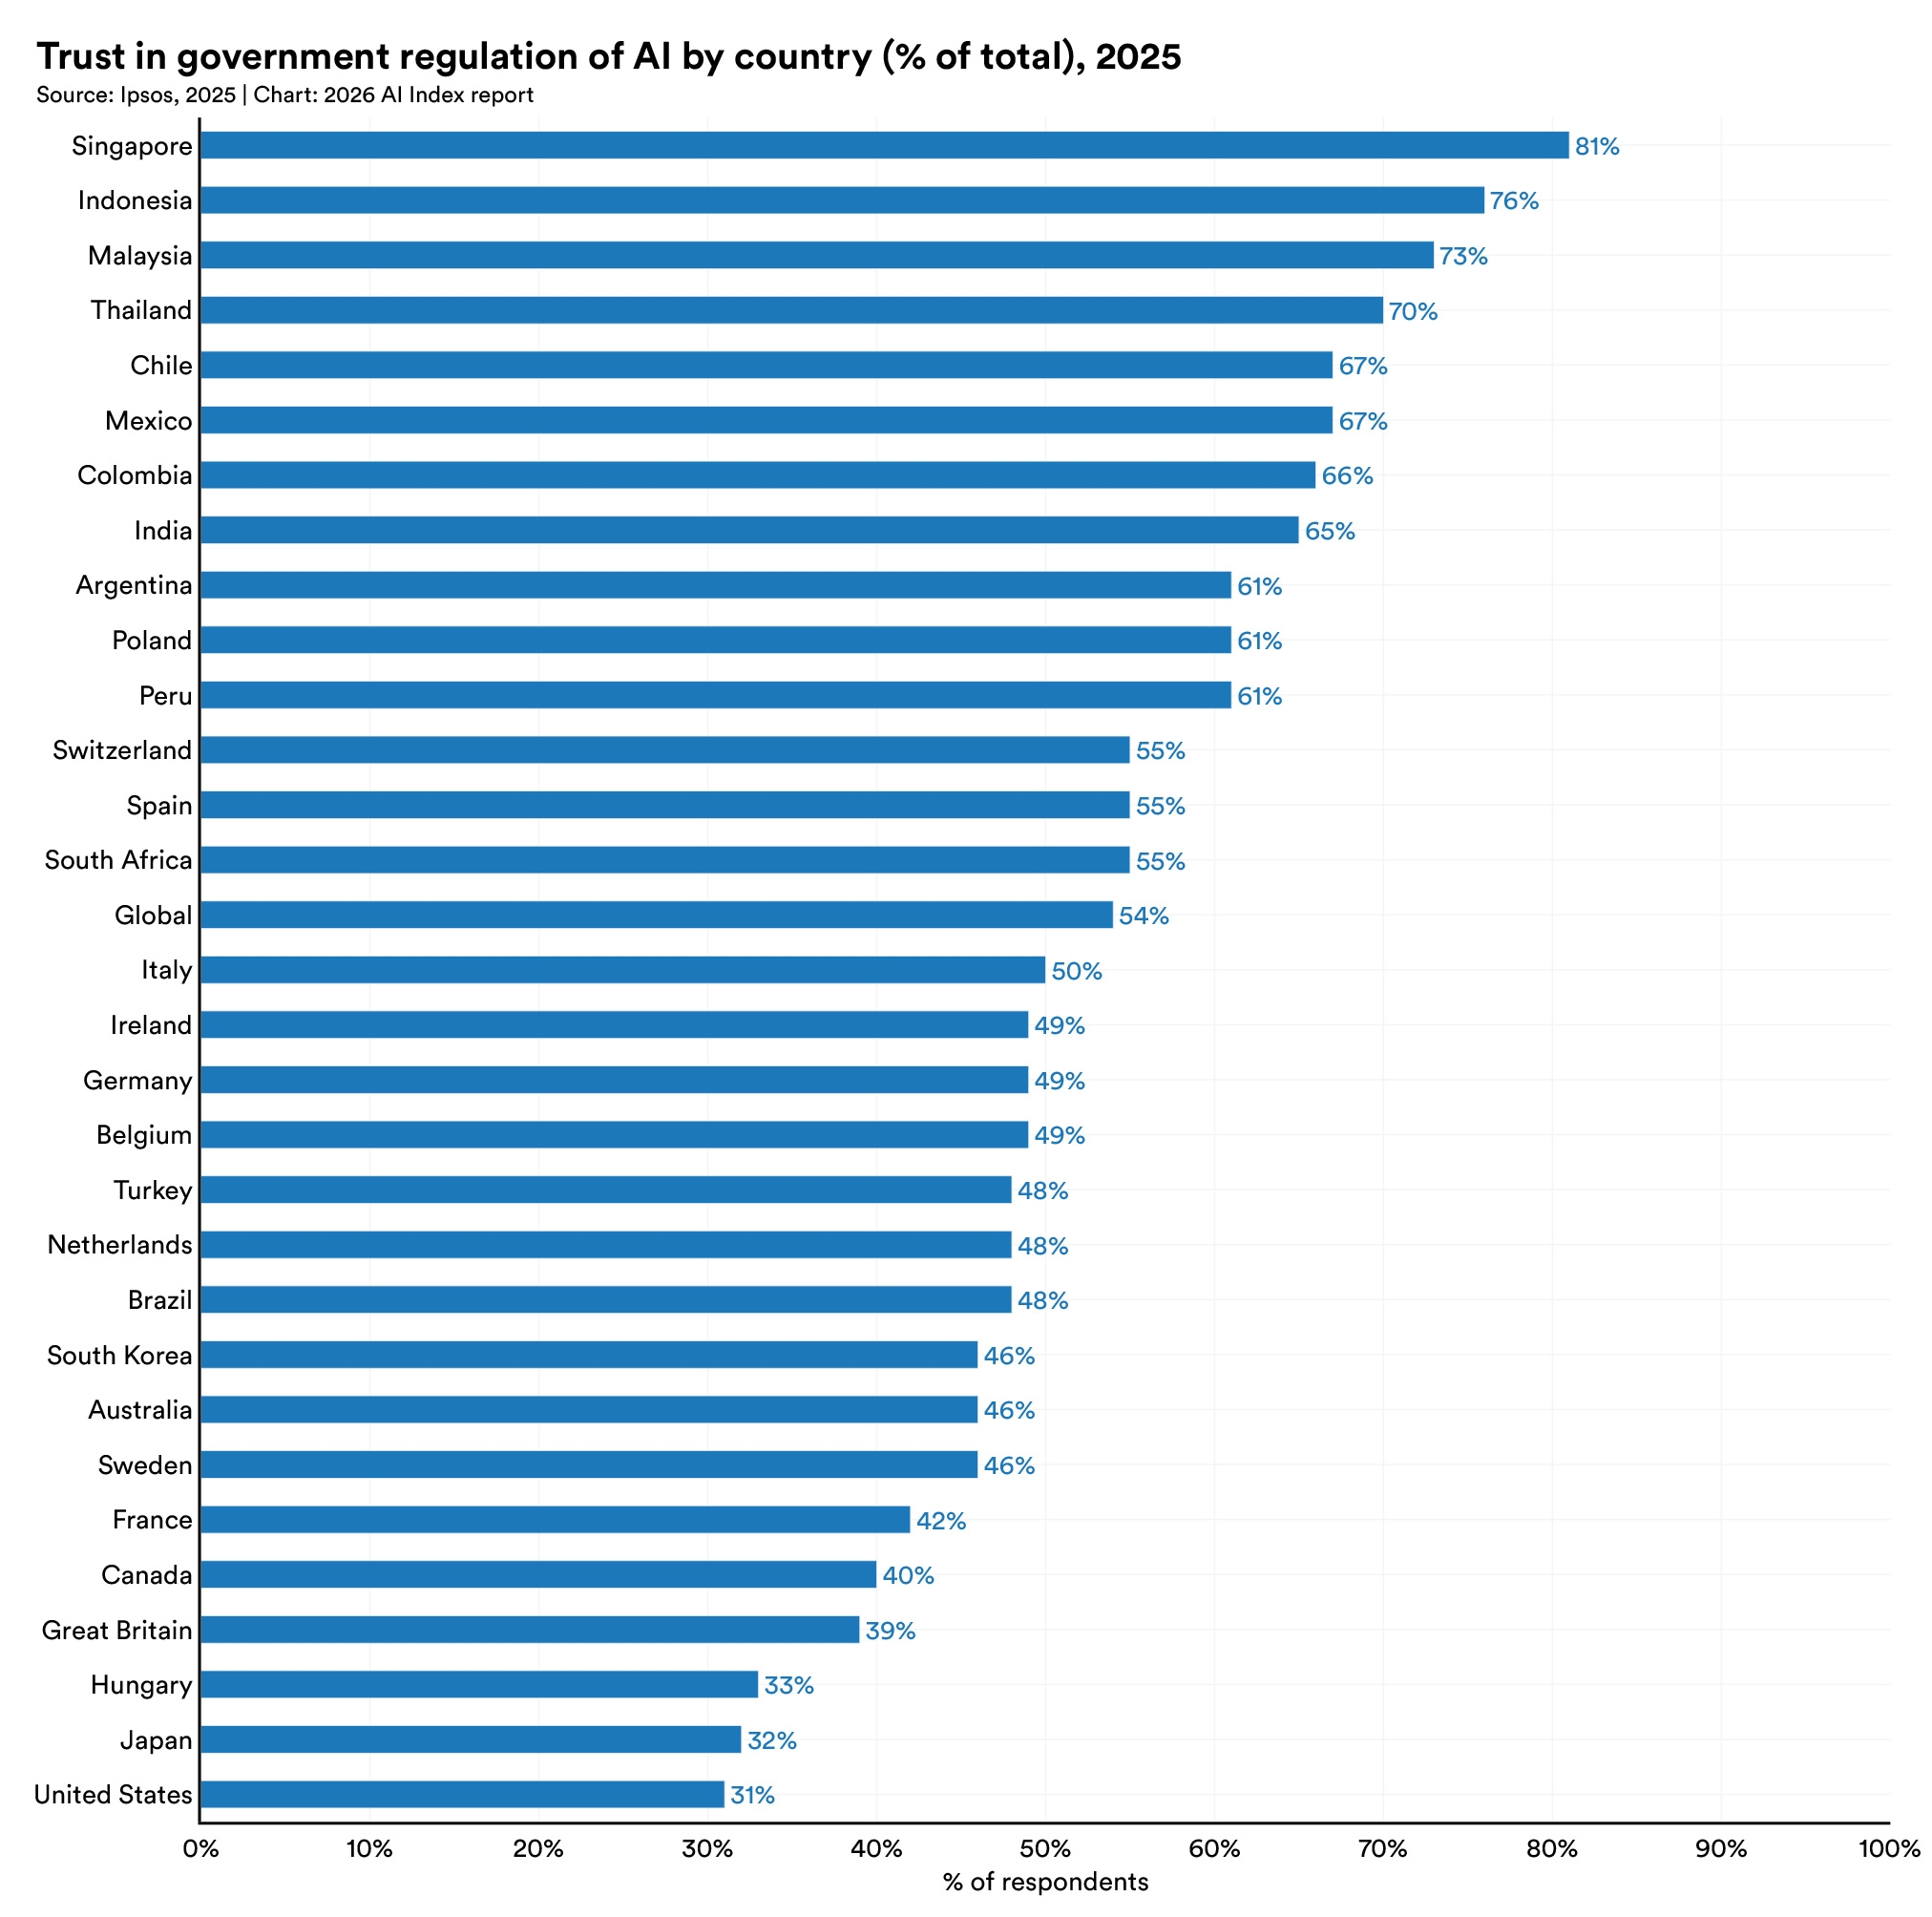
Horizontal bar chart titled "Trust in government regulation of AI by country (% of total), 2025." It shows that Singapore has the highest trust in government regulation of AI at 91%, followed by Indonesia and Malaysia. The United States has the lowest trust at 31%. The chart lists the percentage of respondents in various countries and a global average who trust government regulation of AI.

9. Across all 50 U.S. states, concern about too little AI regulation outweighs concern about too much.

Nationally, 41% of respondents said federal AI regulation will not go far enough, compared with 27% who said it will go too far, though more than one-third were unsure.
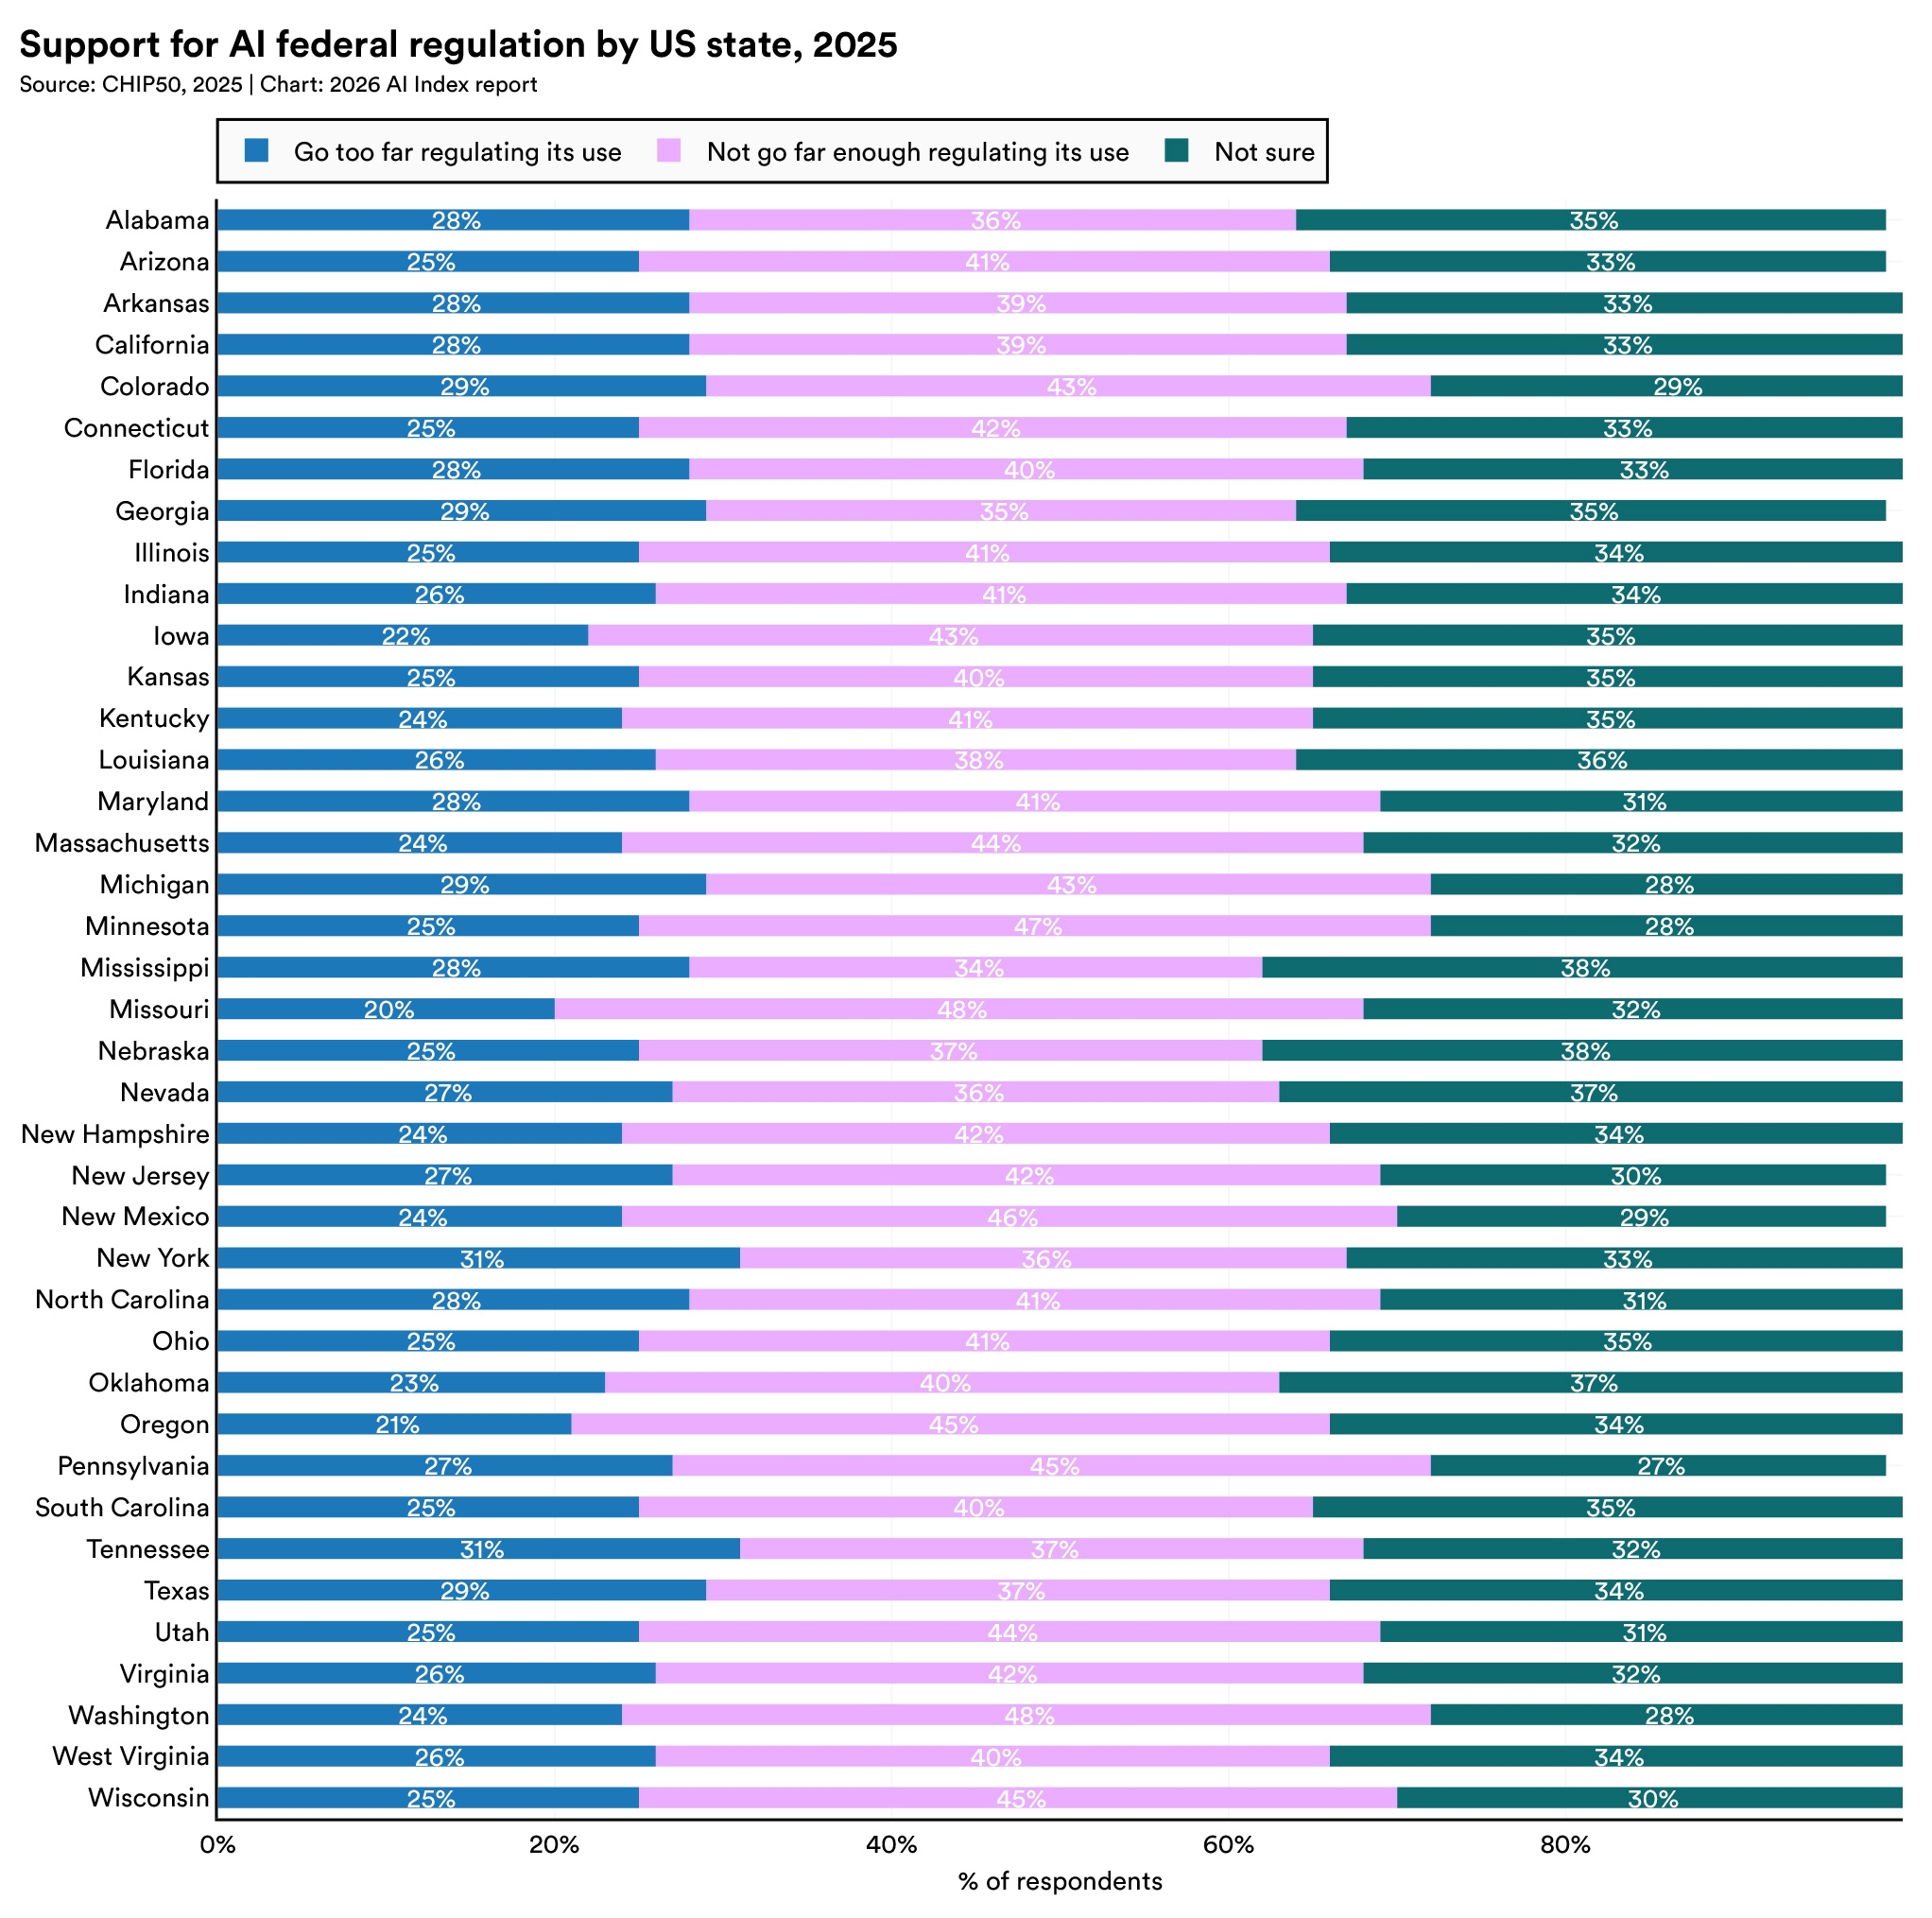
Stacked bar chart titled "Support for AI federal regulation by US state, 2025." It shows that a majority of respondents in most US states feel there is "Not enough regulation" of AI. The "Not sure" category represents a substantial portion of opinions in many states, while "Too little regulation" is the least common view across the board.

10. Globally, the EU is trusted more than the United States or China to regulate AI effectively.

Across 25 countries in Pew's 2025 survey, a median of 53% said they trust the EU, compared to 37% for the United States and 27% for China.
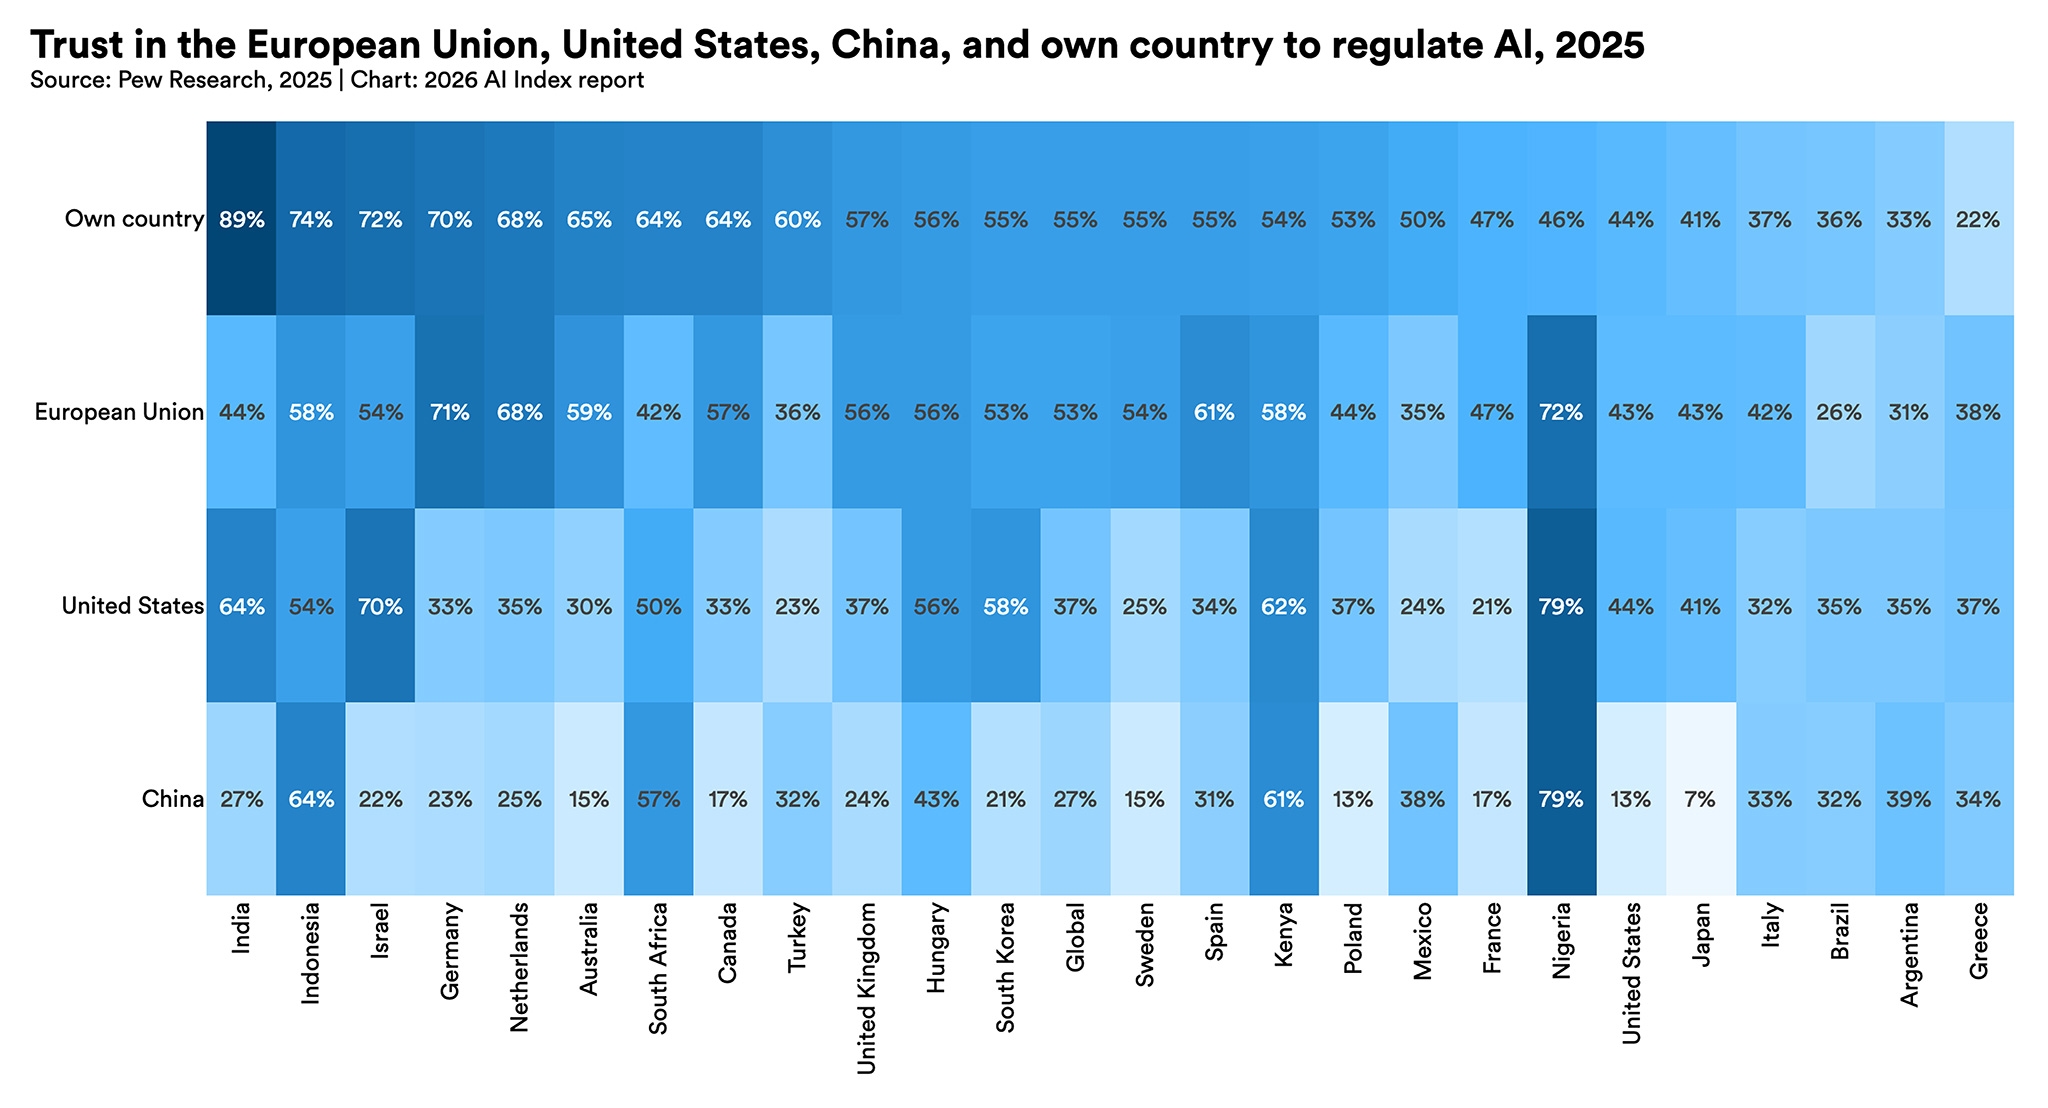
Heatmap titled "Trust in the European Union, United States, China, and own country to regulate AI, 2025." This visualization compares trust in AI regulation by region and country. Respondents express the highest trust in their own country's regulation, while trust in EU and US regulation is more varied. Trust in China's AI regulation is generally the lowest among the surveyed nations. Darker blues indicate higher percentages of trust.

Support the AI Index in our mission to provide comprehensive, unbiased data on artificial intelligence worldwide. Your support sustains rigorous research, data collection, and analysis that informs policymakers, researchers, journalists, and business leaders—ensuring transparent AI metrics guide humanity toward a better future.

Make a Gift to AI Index