Research and Development | The 2026 AI Index Report | Stanford HAI
Stanford
University
  • Stanford Home
  • Maps & Directions
  • Search Stanford
  • Emergency Info
  • Terms of Use
  • Privacy
  • Copyright
  • Trademarks
  • Non-Discrimination
  • Accessibility
© Stanford University.  Stanford, California 94305.
Skip to content
  • About

    • About
    • People
    • Get Involved with HAI
    • Support HAI
    • Subscribe to Email
  • Research

    • Research
    • Research Programs
    • Grants
    • Marlowe (opens in new tab)
    • Student Affinity Groups
    • Centers & Labs
    • Research Publications
    • Research Partners
  • Education

    • Education
    • Executive and Professional Education
    • Government and Policymakers
    • K-12
    • Stanford Students
  • Policy

    • Policy
    • Policy Publications
    • Policymaker Education
    • Student Opportunities
  • AI Index

    • AI Index
    • AI Index Report
    • Global Vibrancy Tool
    • People
  • News
  • Events
  • Industry
  • Centers & Labs
Navigate
  • About
  • Events
  • AI Glossary
  • Careers
  • Search
Participate
  • Get Involved
  • Support HAI
  • Contact Us

Stay Up To Date

Get the latest news, advances in research, policy work, and education program updates from HAI in your inbox weekly.

Sign Up For Latest News

01

Research and Development

Democracy
Generative AI

This chapter tracks developments across AI research and development, covering the models and open-source ecosystems driving progress, the infrastructure and environmental footprint supporting it, and the publications, patents and investors shaping the field.

Download Full Chapter
See Chapter 2

All Chapters

  • Back to Overview
  • 01Research and Development
  • 02Technical Performance
  • 03Responsible AI
  • 04Economy
  • 05Science
  • 06Medicine
  • 07Education
  • 08Policy and Governance
  • 09Public Opinion

1. Industry produced over 90% of notable AI models in 2025, but the most capable models are now the least transparent.

Training code, parameter counts, dataset sizes, and training duration are no longer disclosed for several of the most resource-intensive systems, including those from OpenAI, Anthropic, and Google.

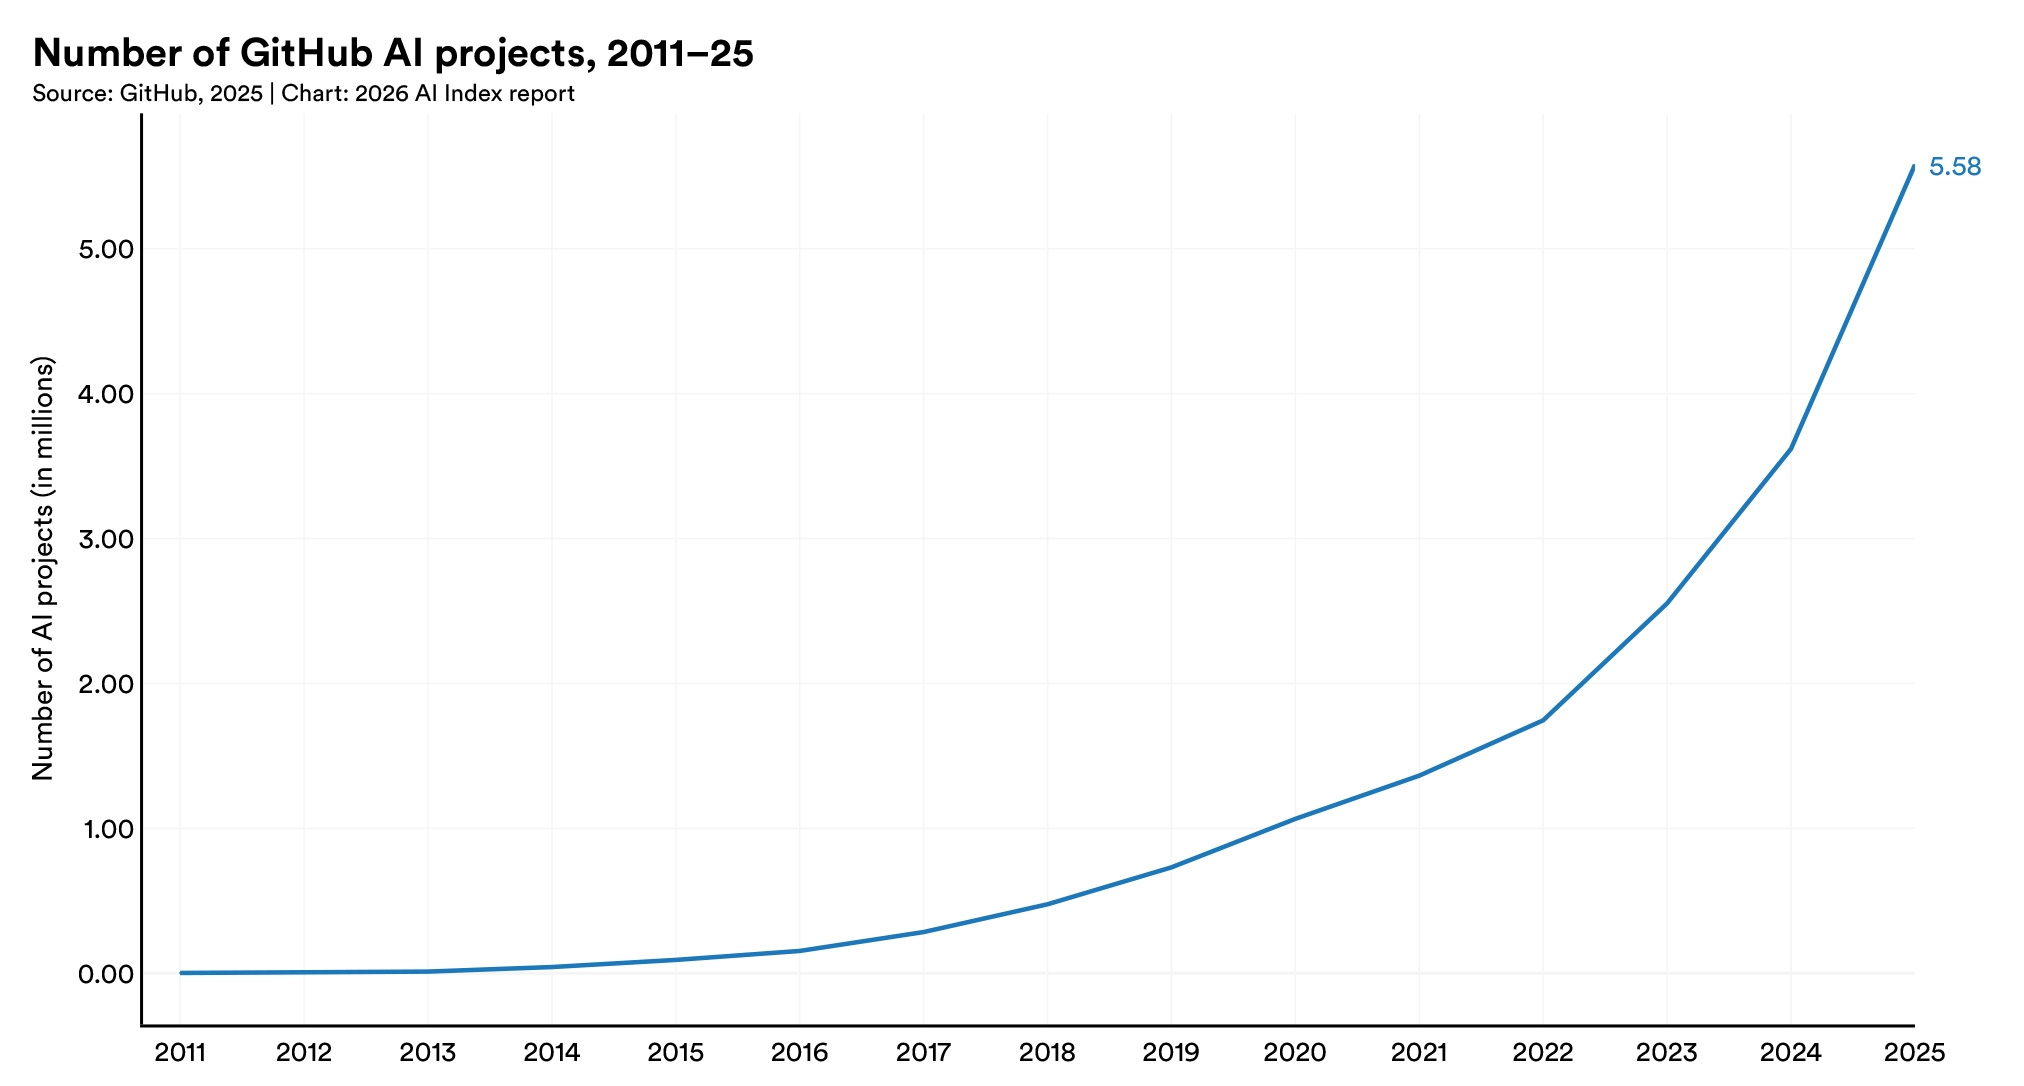
Line chart showing GitHub AI projects growing from near zero in 2011 to 5.58 million in 2025, with especially rapid growth after 2022.

2. China leads in research, while the U.S. leads in notable model development.

China leads in publication volume, citations, and patent grants, while the U.S. retains higher-impact patents and produced 59 notable models in 2025 to China's 35. South Korea leads in AI patents per capita, and China's share of the top 100 most-cited AI papers grew from 33 in 2021 to 41 in 2024.
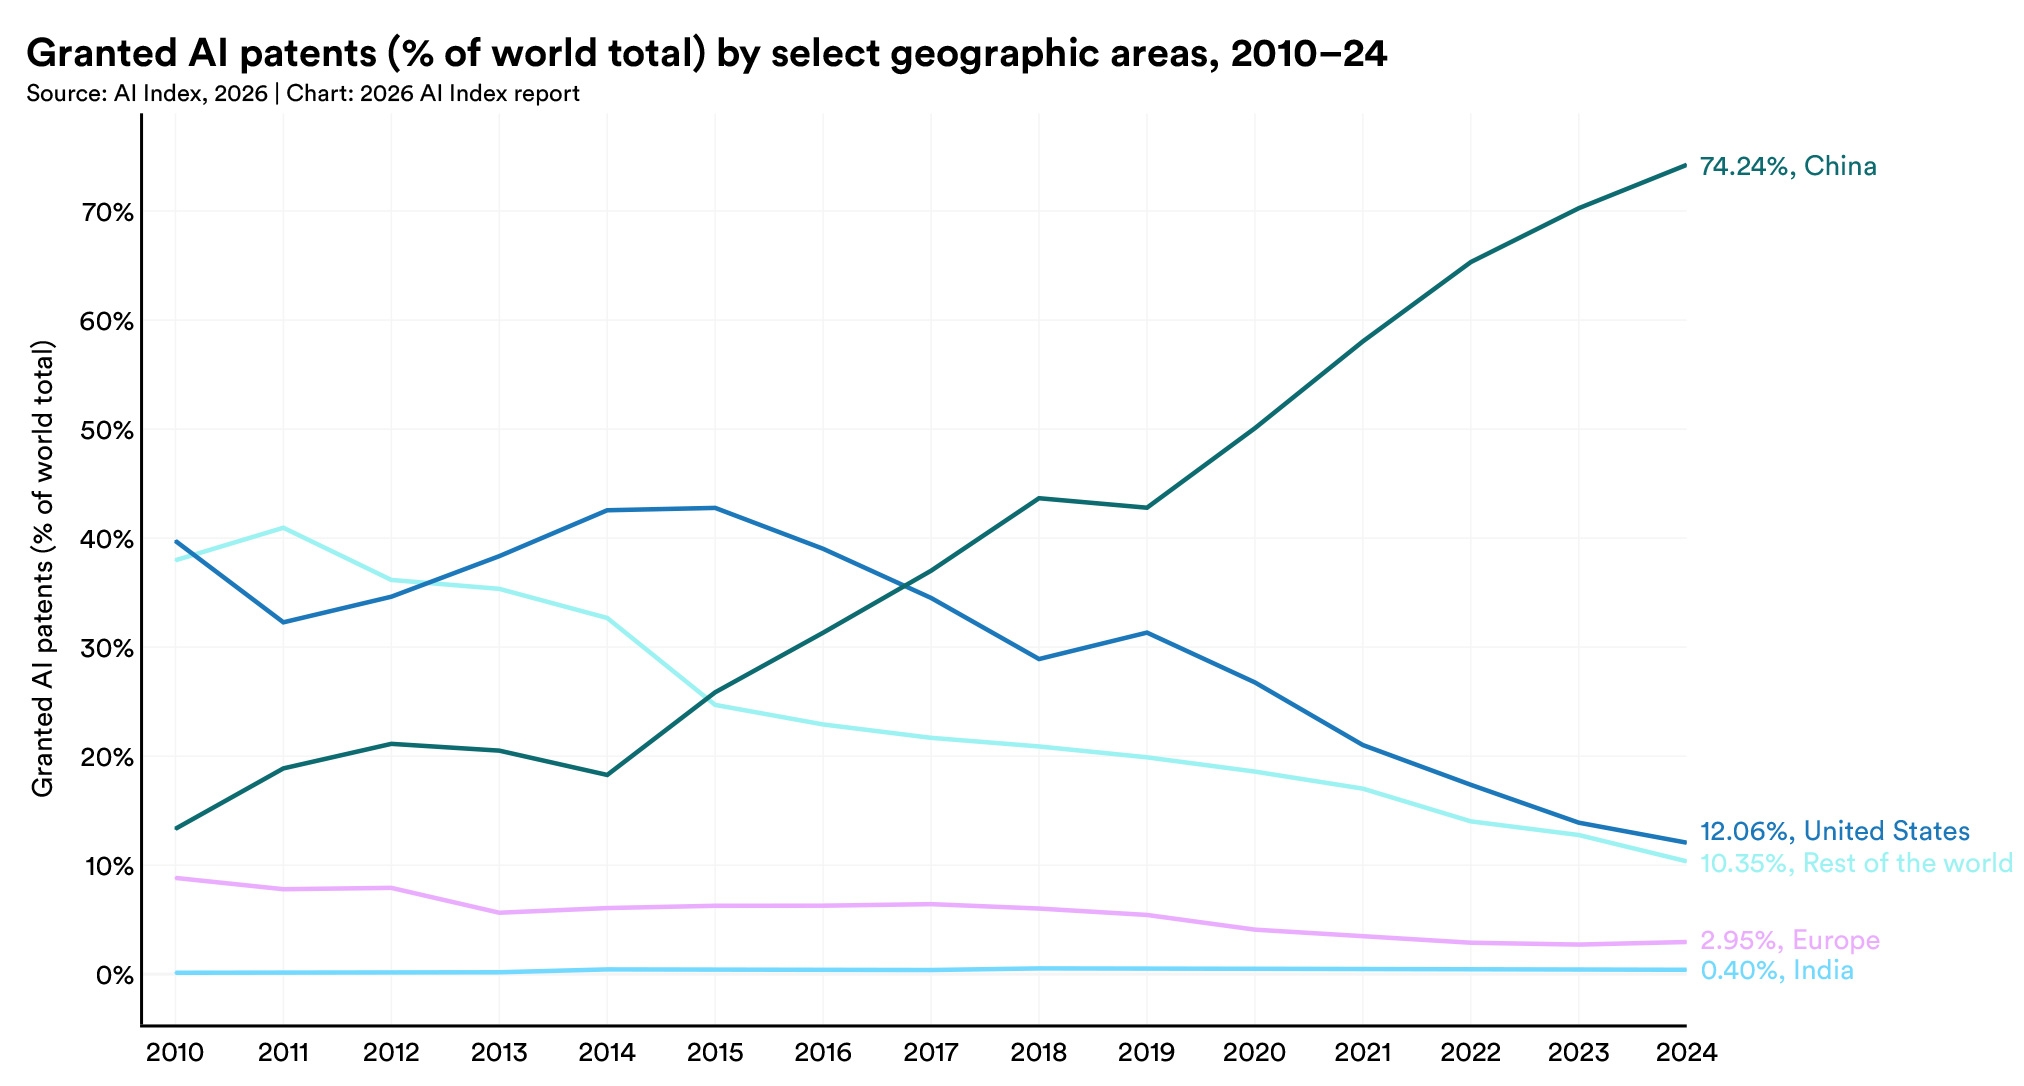
Line chart showing China’s share of granted AI patents rising sharply from 2010 to 2024, while the U.S. and rest of the world decline. Europe and India remain comparatively small.

3. Reported parameters held in the trillions as disclosure dropped.

Parameter counts have stayed near 1 trillion for three years, though reporting from frontier labs has stopped. Training compute, which can be estimated independently, has continued to rise.
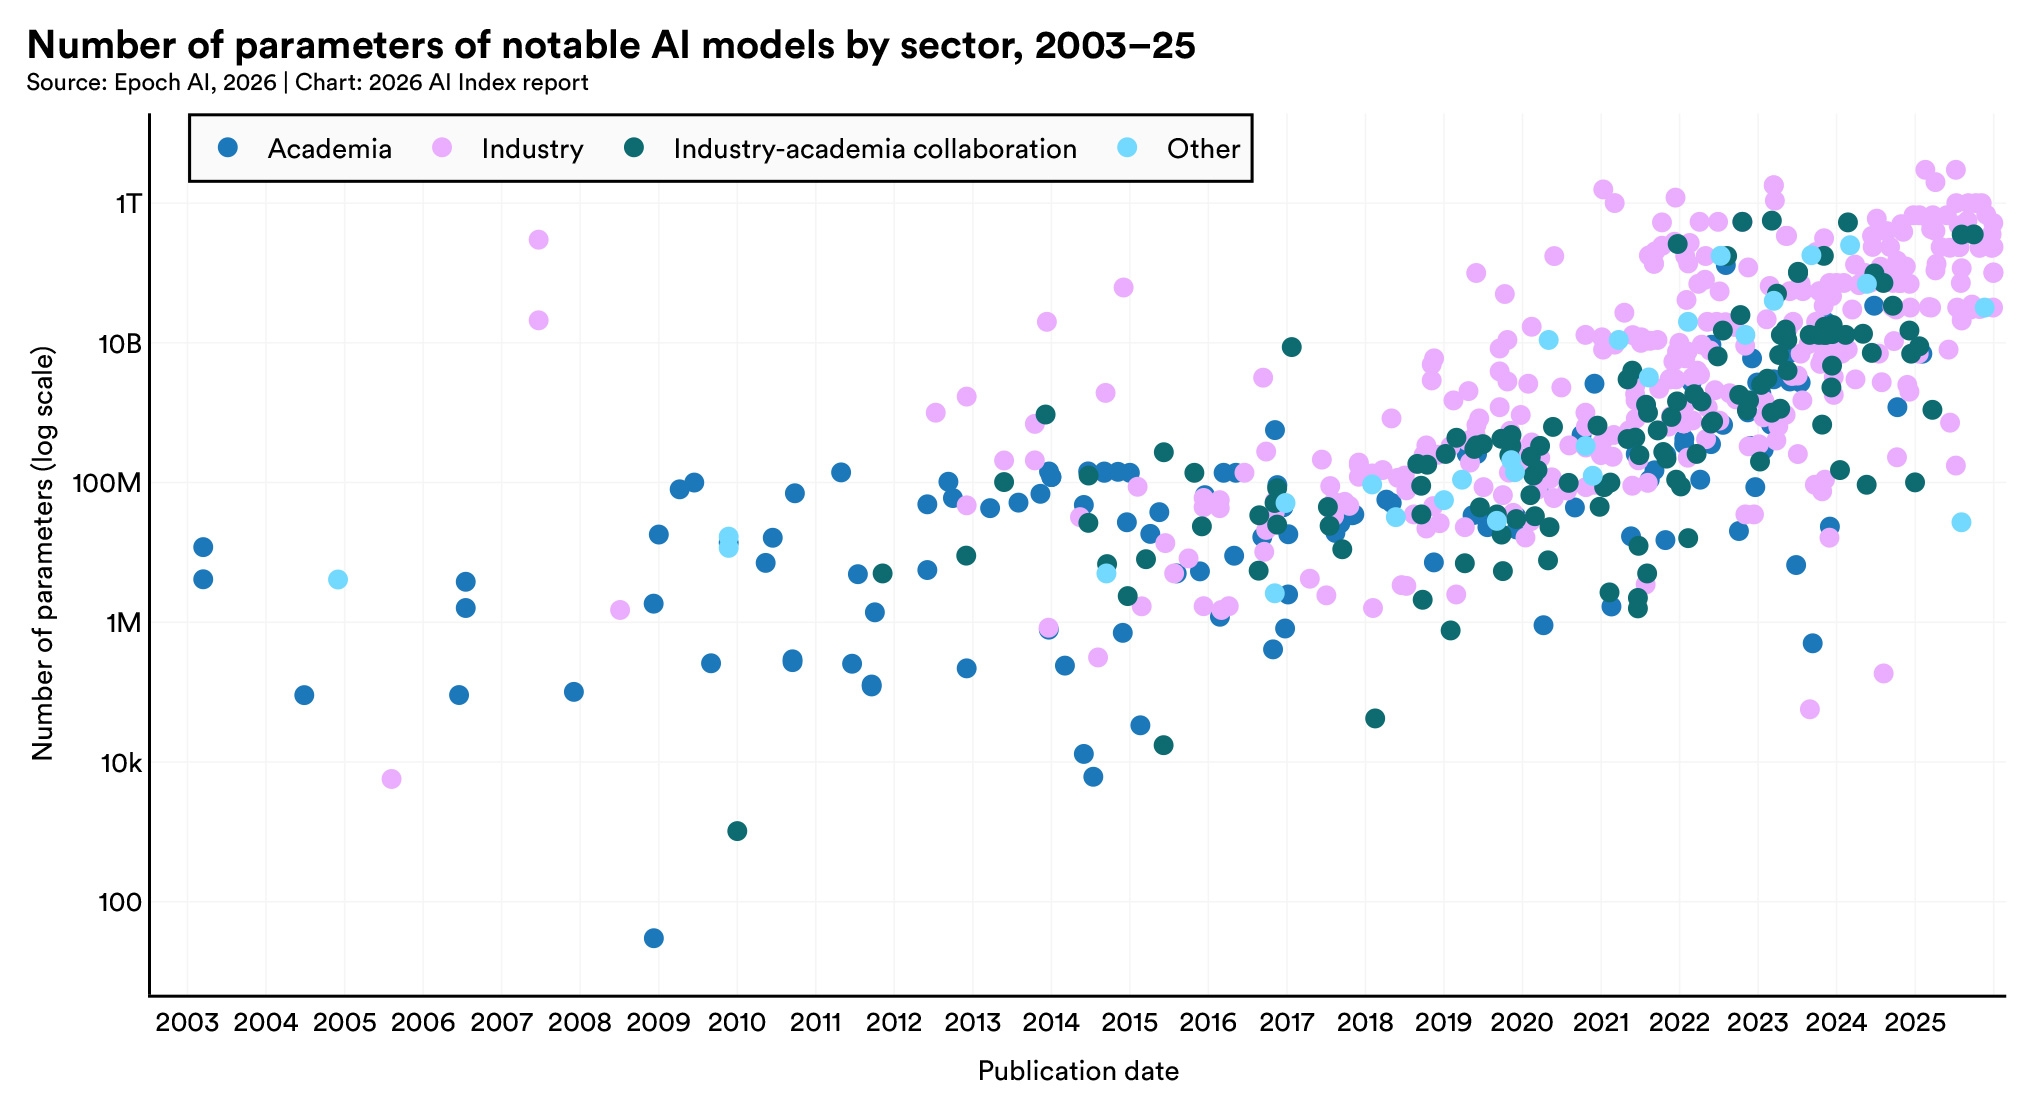
Scatter plot showing notable AI model parameter counts rising over time, especially after 2018. Industry-developed models are most numerous among the largest models; academia and collaborations also contribute.

4. Synthetic data is still not replacing real data in pre-training, but data quality and post-training techniques are showing promise.

OLMo 3.1 Think 32B, with nearly 90 times fewer parameters than Grok 4, achieves comparable results on several benchmarks through pruning, deduplication, and curation alone.
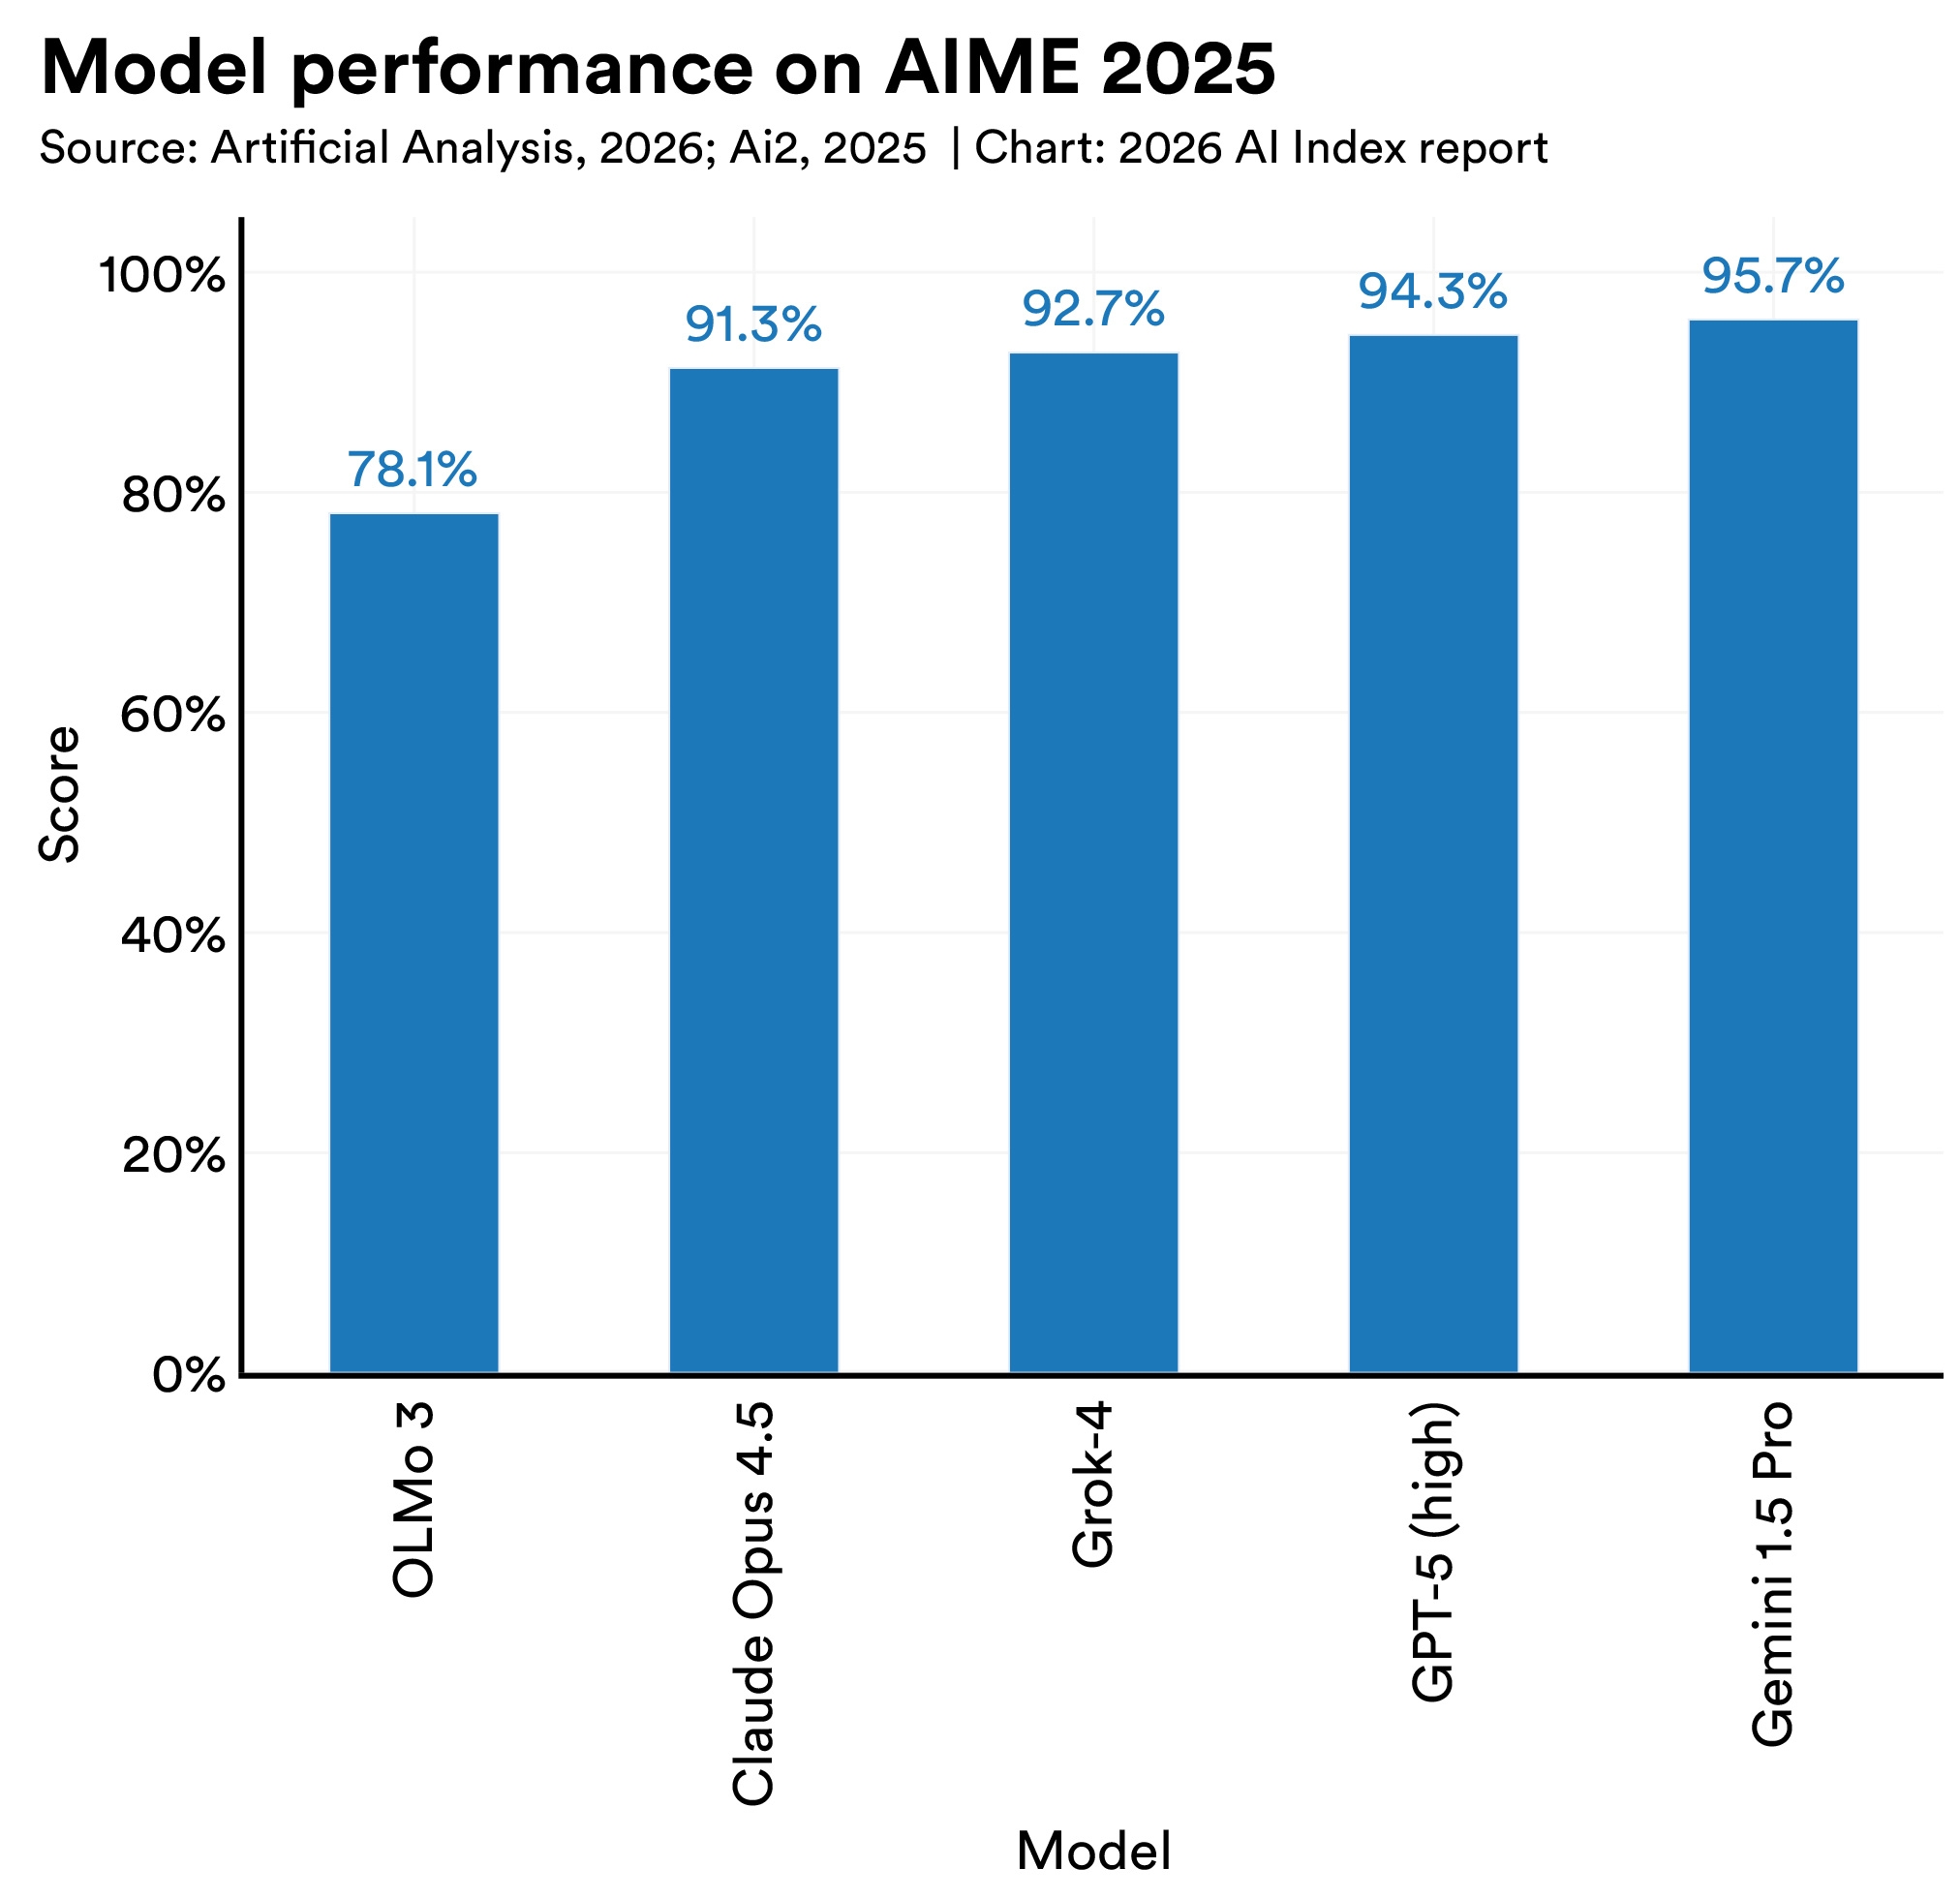
Bar chart comparing AIME 2025 scores: OLMo 3 scores lowest at 78.1%, while Gemini 1.5 Pro scores highest at 95.7%. Other models score between 91.3% and 94.3%.

5. Global AI compute capacity grew 3.3x per year since 2022, reaching 17.1 million H100-equivalents.

Nvidia accounts for over 60% of total compute, with Google and Amazon supplying much of the remainder and Huawei holding a small but growing share. The buildout is being driven by hyperscaler data center expansion and sustained demand for frontier model training and inference.
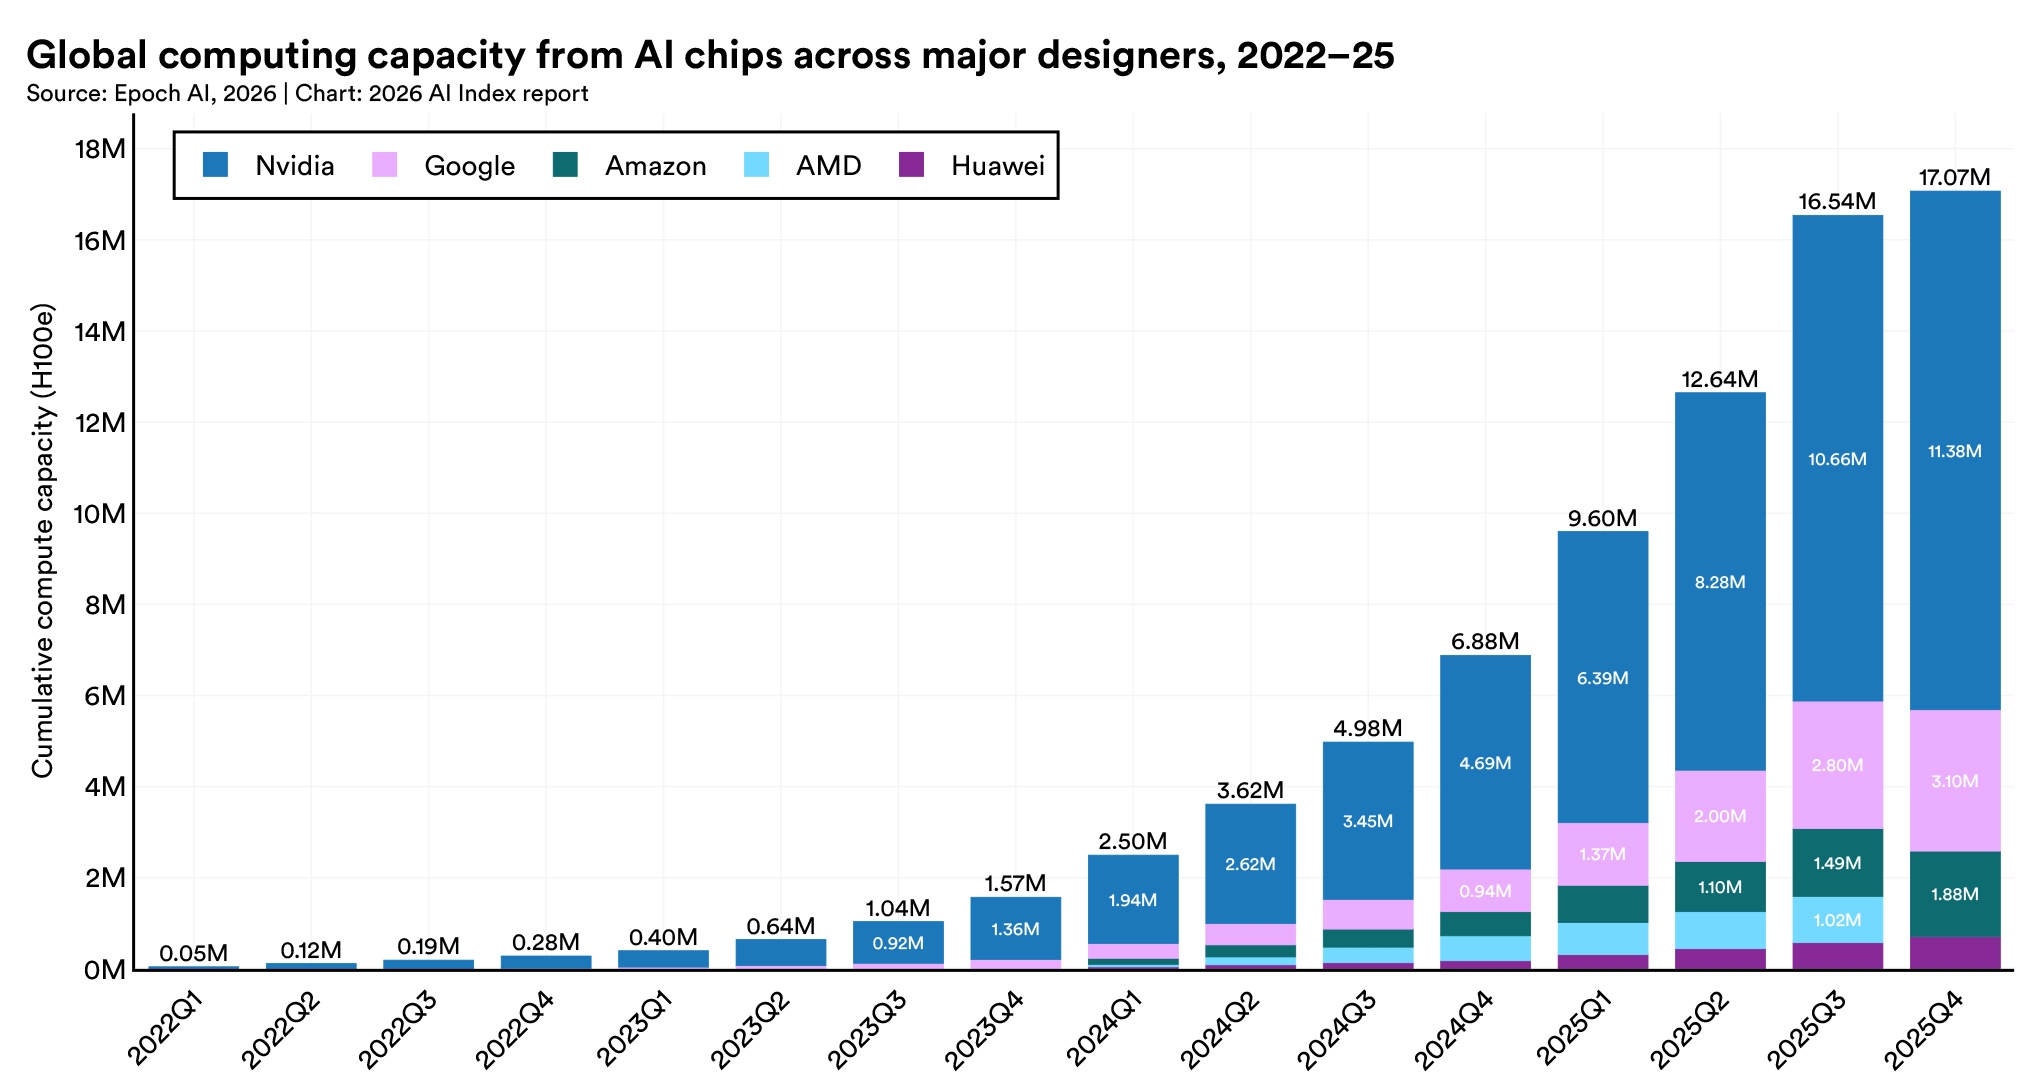
Stacked bar chart showing AI chip computing capacity rising from 0.05 million H100-equivalents in 2022 Q1 to 17.07 million in 2025 Q4. Nvidia accounts for the largest share throughout.

6. The United States leads in AI data centers, and one Taiwanese foundry fabricates the majority of chips inside them.

The United States hosts 5,427 data centers, more than ten times any other country, and consuming more energy than any other region. A single company, TSMC, fabricates almost every leading AI chip and makes the global AI hardware supply chain dependent on one foundry in Taiwan, though a TSMC-U.S. expansion began to operate in 2025.
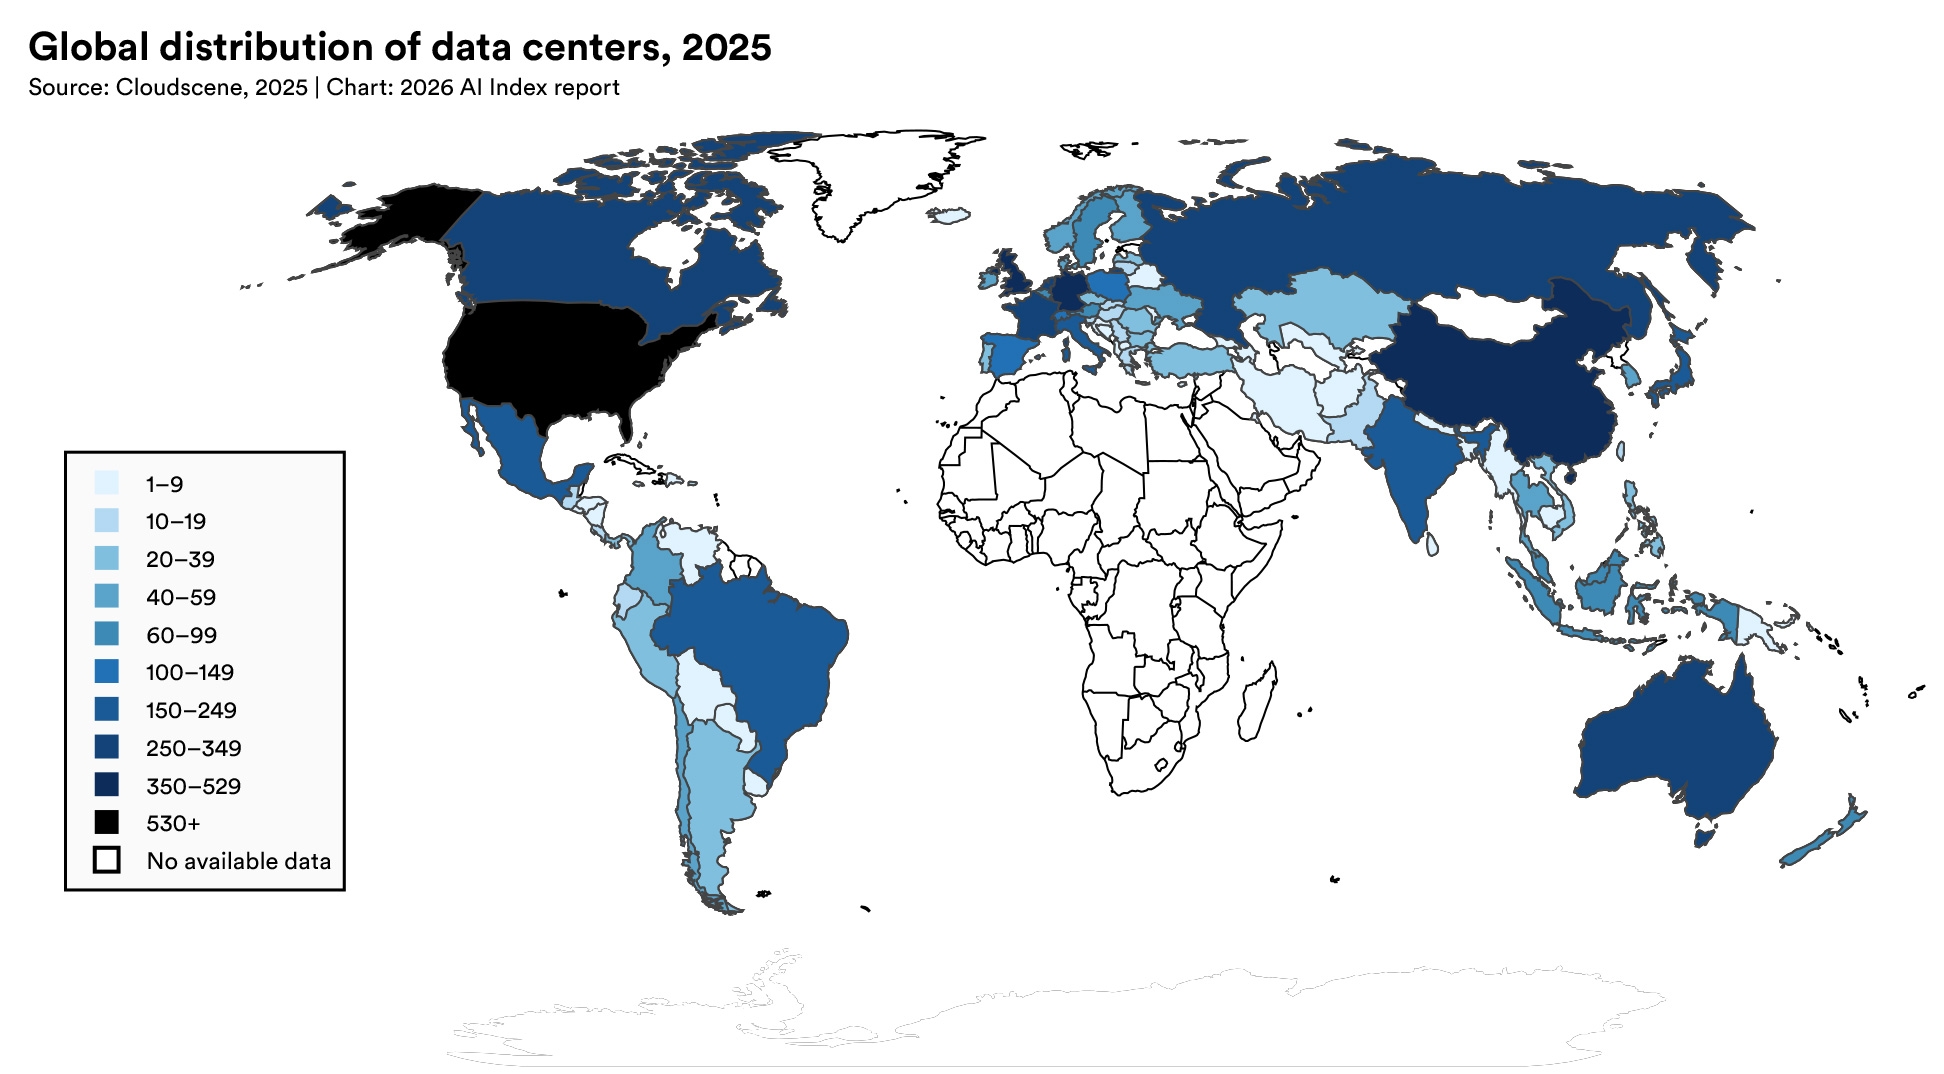
World map showing data center counts by country in 2025. The United States has the most, followed by China; counts are also relatively high in Canada, Russia, Australia, Brazil, and parts of Europe. Many African countries have no available data.

7. AI’s environmental footprint increases across power, water, and emissions.

In 2025, Grok 4’s estimated training emissions reached 72,816 tons of CO₂ equivalent. AI data center power capacity rose to 29.6 GW, comparable to New York state at peak demand, and annual GPT-4o inference water use alone may exceed the drinking water needs of 1.2 million people.
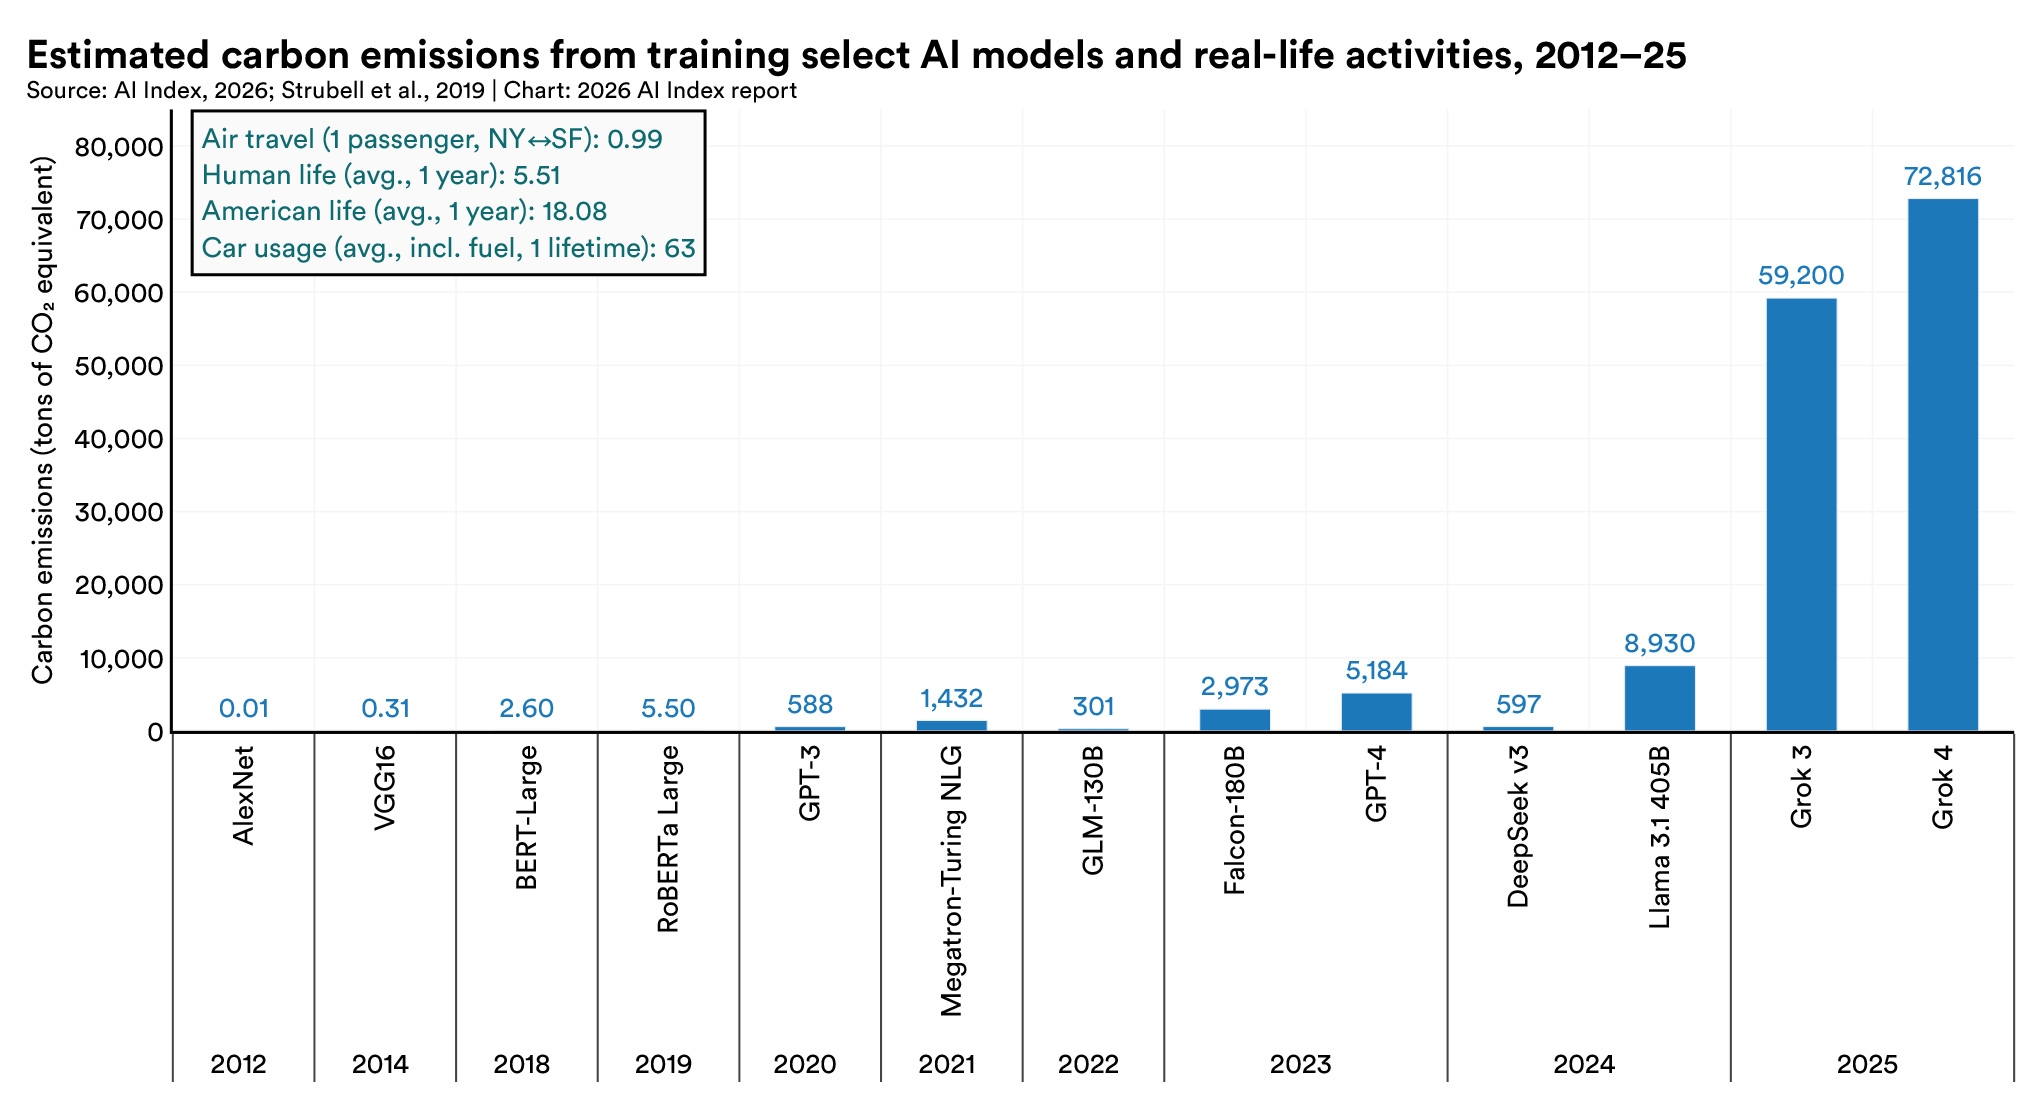
Bar chart comparing estimated training emissions for selected AI models, 2012–25. Emissions rise sharply for newer models, reaching 59,200 tons of CO₂ equivalent for Grok 3 and 72,816 for Grok 4. A box compares these totals with everyday activities.

8. Open-source AI development continues to scale, with 5.6 million projects on GitHub and Hugging Face uploads tripling since 2023.

U.S.-based projects still attract the most engagement, with 30 million cumulative GitHub stars across projects that have crossed the 10-star threshold. 
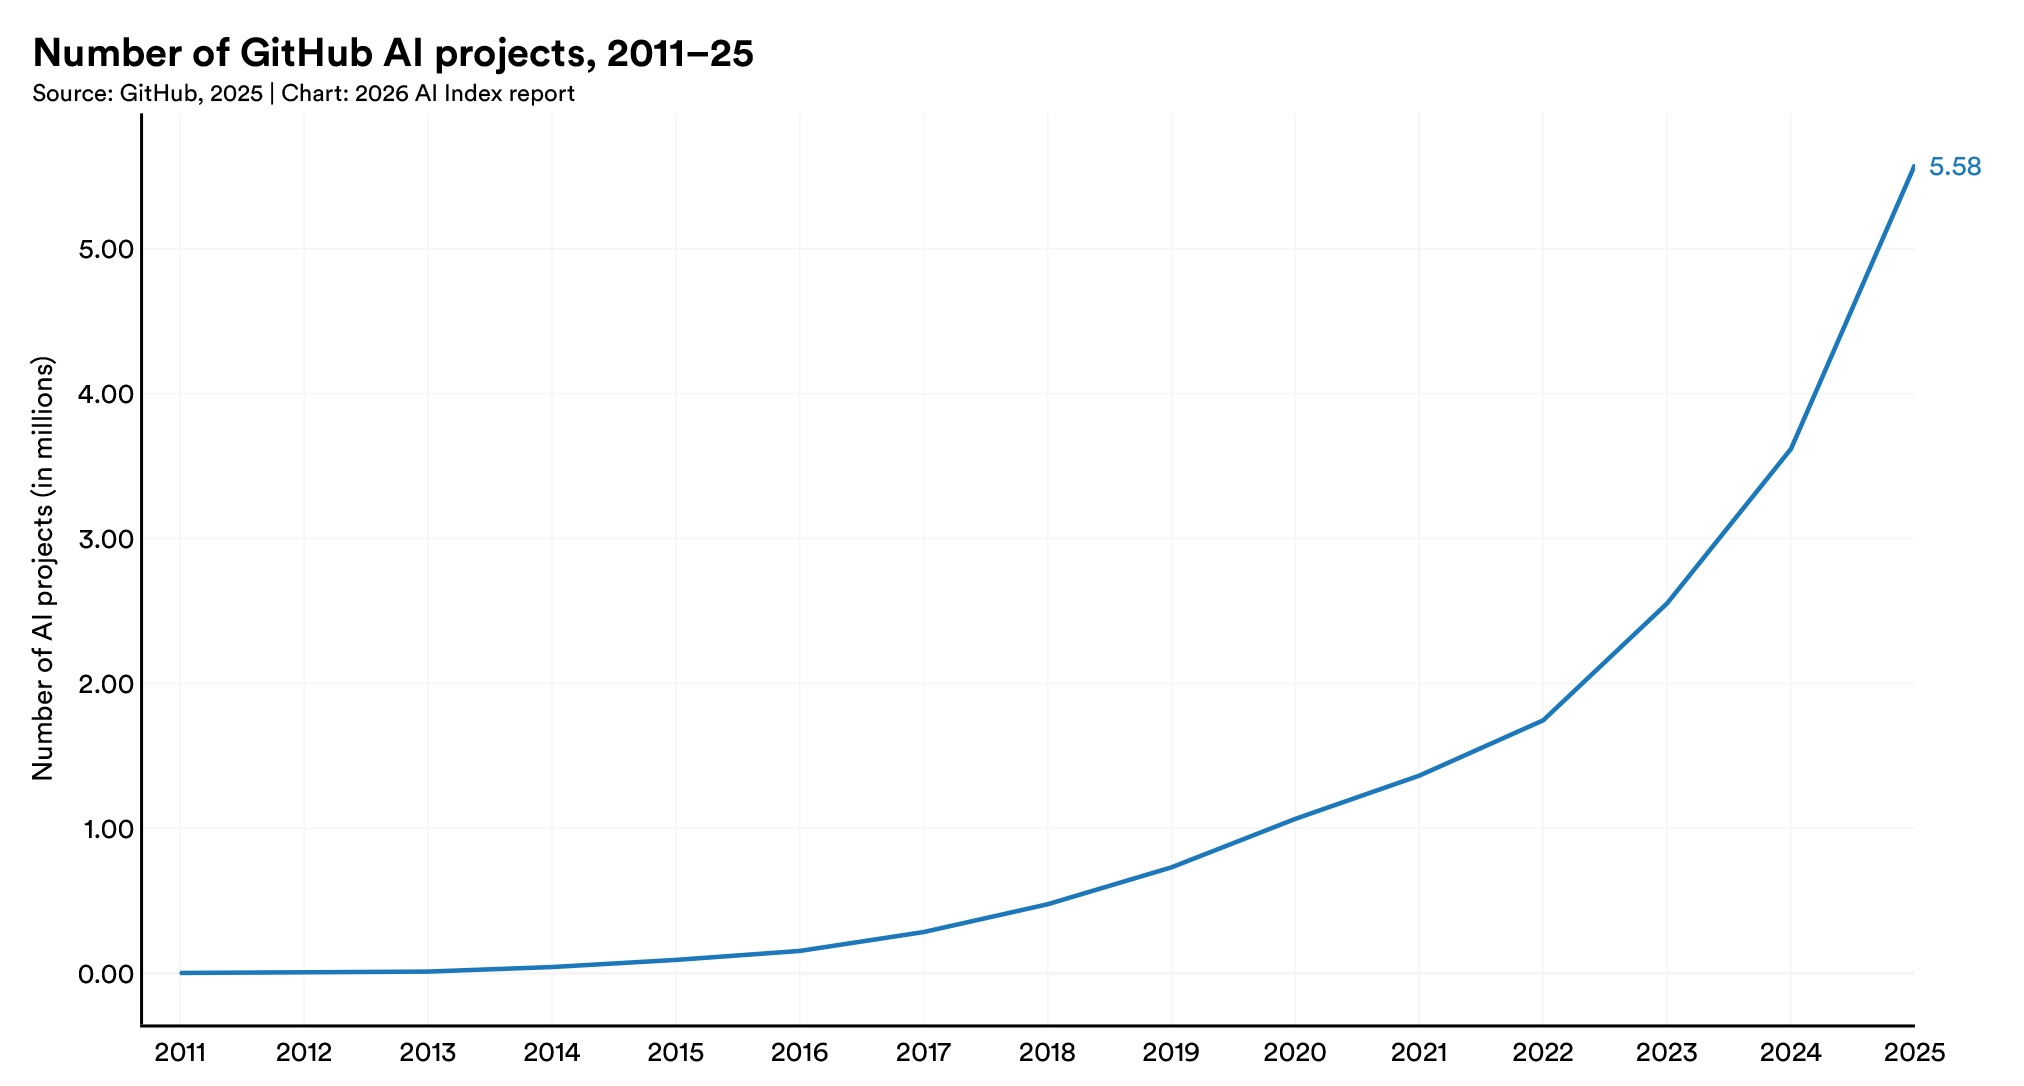
Line chart showing GitHub AI projects rising steadily from near zero in 2011 to 5.58 million in 2025, with rapid growth after 2022.

9. The number of AI researchers and developers moving to the United States has dropped 89% since 2017.

The decline is accelerating, down 80% in the last year alone. The U.S. is still home to more AI talent than any other country, but it is attracting new talent at the lowest rate in over a decade.
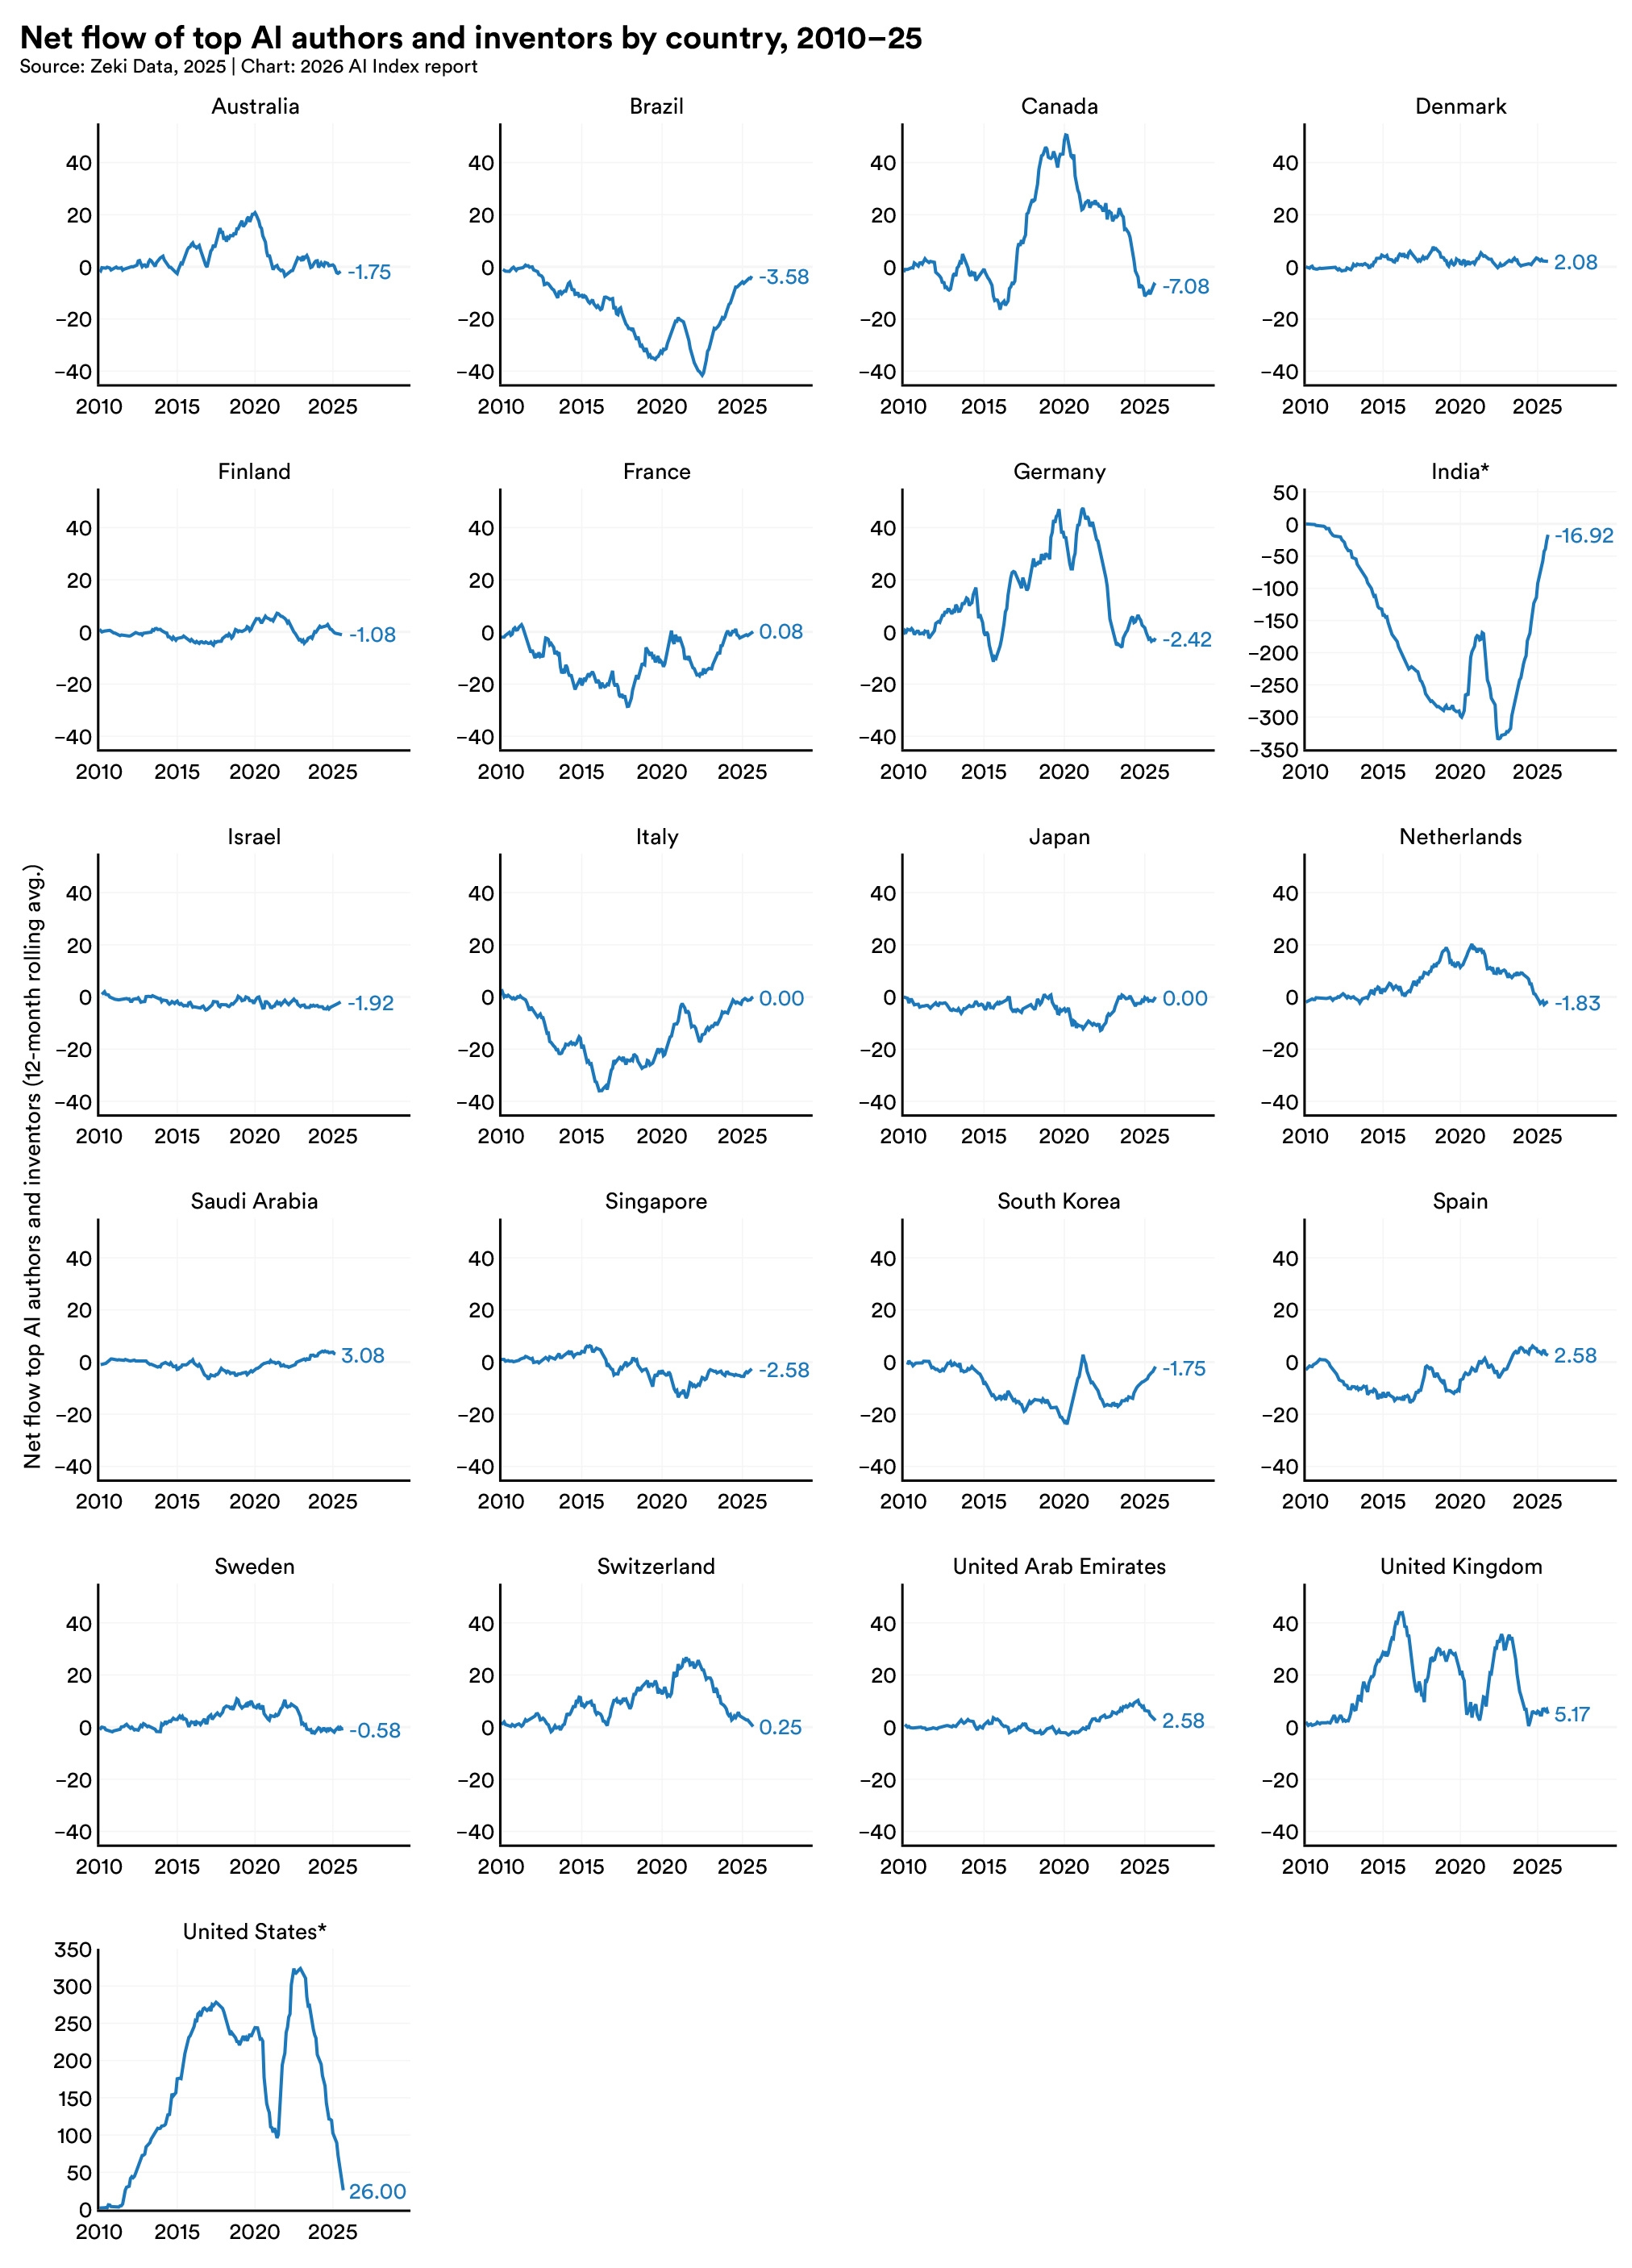
Small-multiple line charts of net flows of AI authors and inventors across 19 countries, 2010–25. The United States shows the largest positive flow, while India’s sharply negative flow rebounds near the end; most other countries fluctuate closer to zero.

10. The AI talent map is shifting, but gender gaps remain.

Switzerland and Singapore lead the world in AI researchers and developers per capita and some countries show relatively higher female representation, including Saudi Arabia (32.3%), Canada (29.6%), and Australia (30.1%), though no country approaches gender parity.
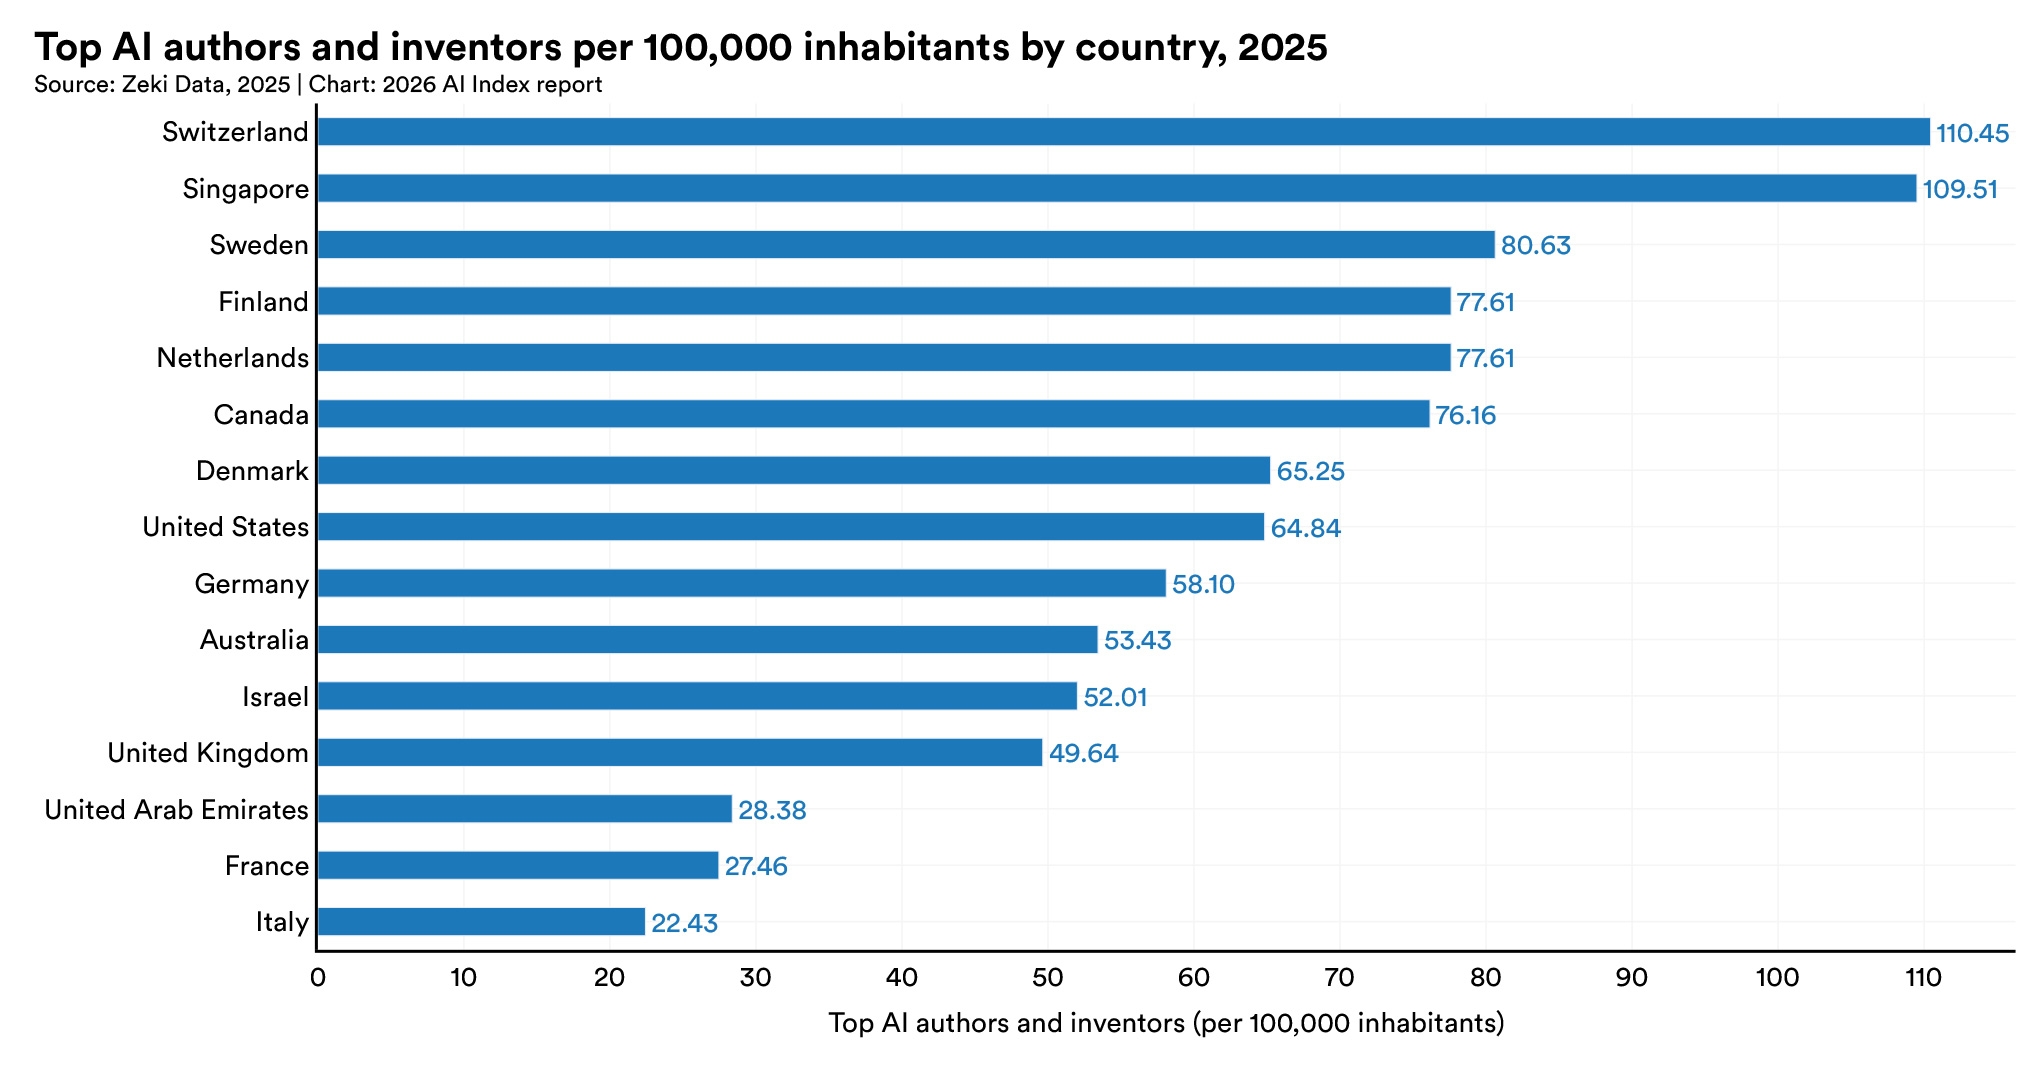
Horizontal bar chart ranking countries by top AI authors and inventors per 100,000 inhabitants in 2025. Switzerland and Singapore lead at about 110 each, while Italy ranks lowest among those shown at 22.43.

Support the AI Index in our mission to provide comprehensive, unbiased data on artificial intelligence worldwide. Your support sustains rigorous research, data collection, and analysis that informs policymakers, researchers, journalists, and business leaders—ensuring transparent AI metrics guide humanity toward a better future.

Make a Gift to AI Index