Read the full report: 2026 AI Index Report
The AI Index report tracks, collates, distills, and visualizes data related to artificial intelligence (AI). Our mission is to provide unbiased, rigorously vetted, broadly sourced data in order for policymakers, researchers, executives, journalists, and the general public to develop a more thorough and nuanced understanding of the complex field of AI.
Access the Public Data
At Stanford HAI, we believe AI is poised to be the most transformative technology of the 21st century. But its benefits won’t be evenly distributed unless we guide its development thoughtfully. The AI Index offers one of the most comprehensive, data-driven views of artificial intelligence. Recognized as a trusted resource by global media, governments, and leading companies, the AI Index equips policymakers, business leaders, and the public with rigorous, objective insights into AI’s technical progress, economic influence, and societal impact. Download the report
Read the translation
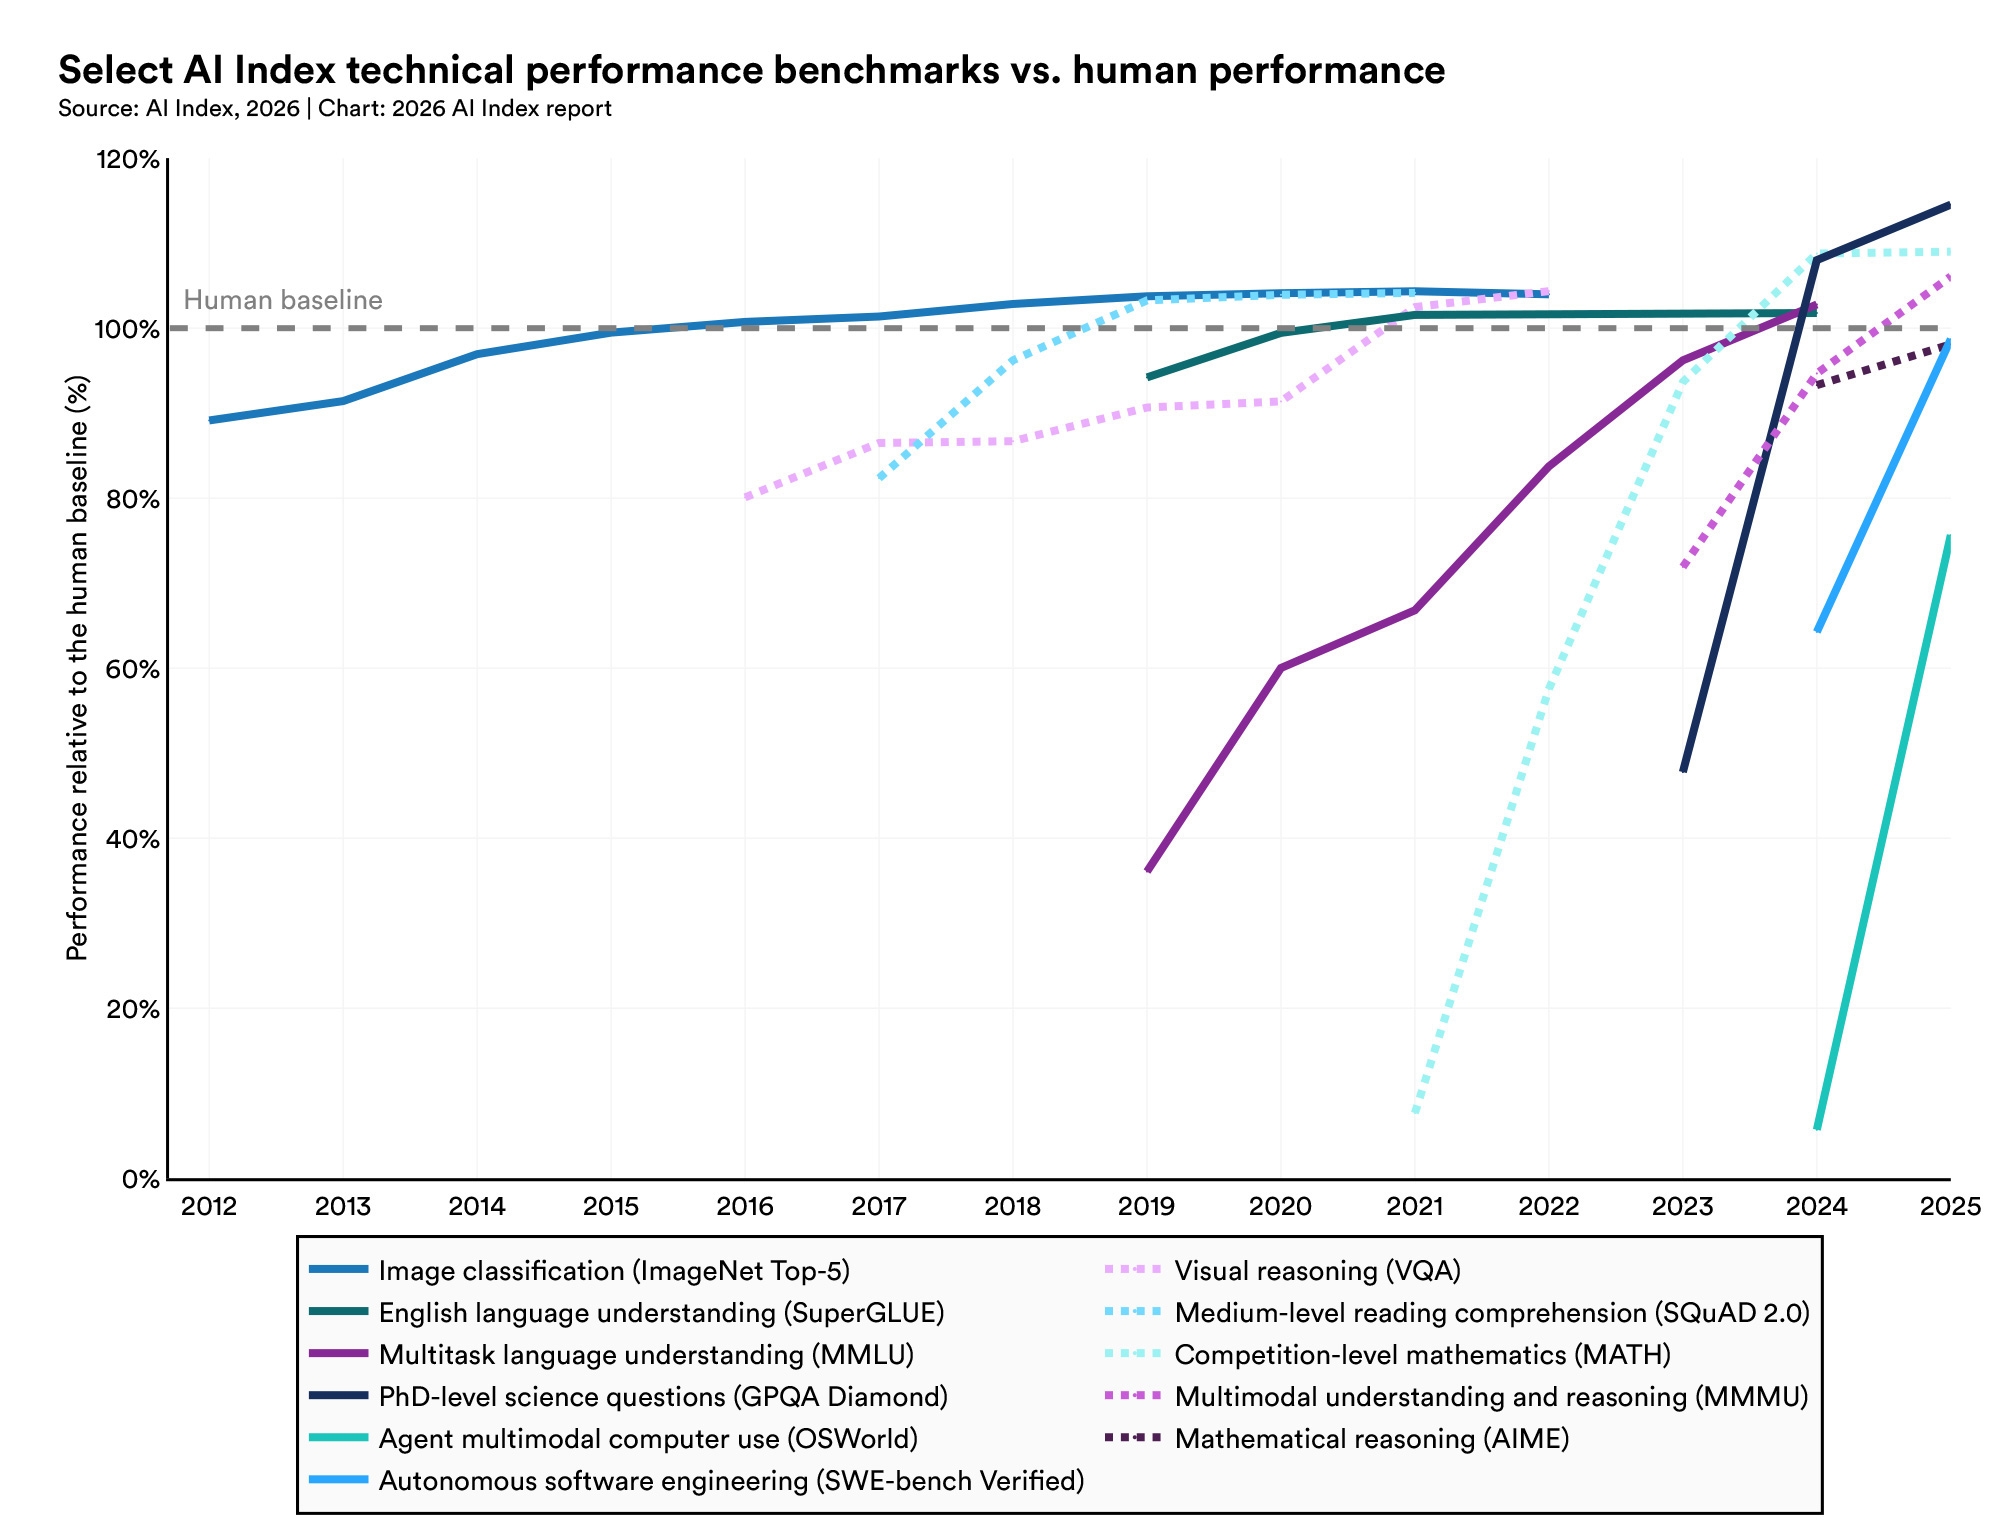
Industry produced over 90% of notable frontier models in 2025, and several of those models now meet or exceed human baselines on PhD-level science questions, multimodal reasoning, and competition mathematics. On a key coding benchmark—SWE-bench Verified—performance rose from 60% to near 100% in a single year. Organizational adoption reached 88%, and 4 in 5 university students now use generative AI.
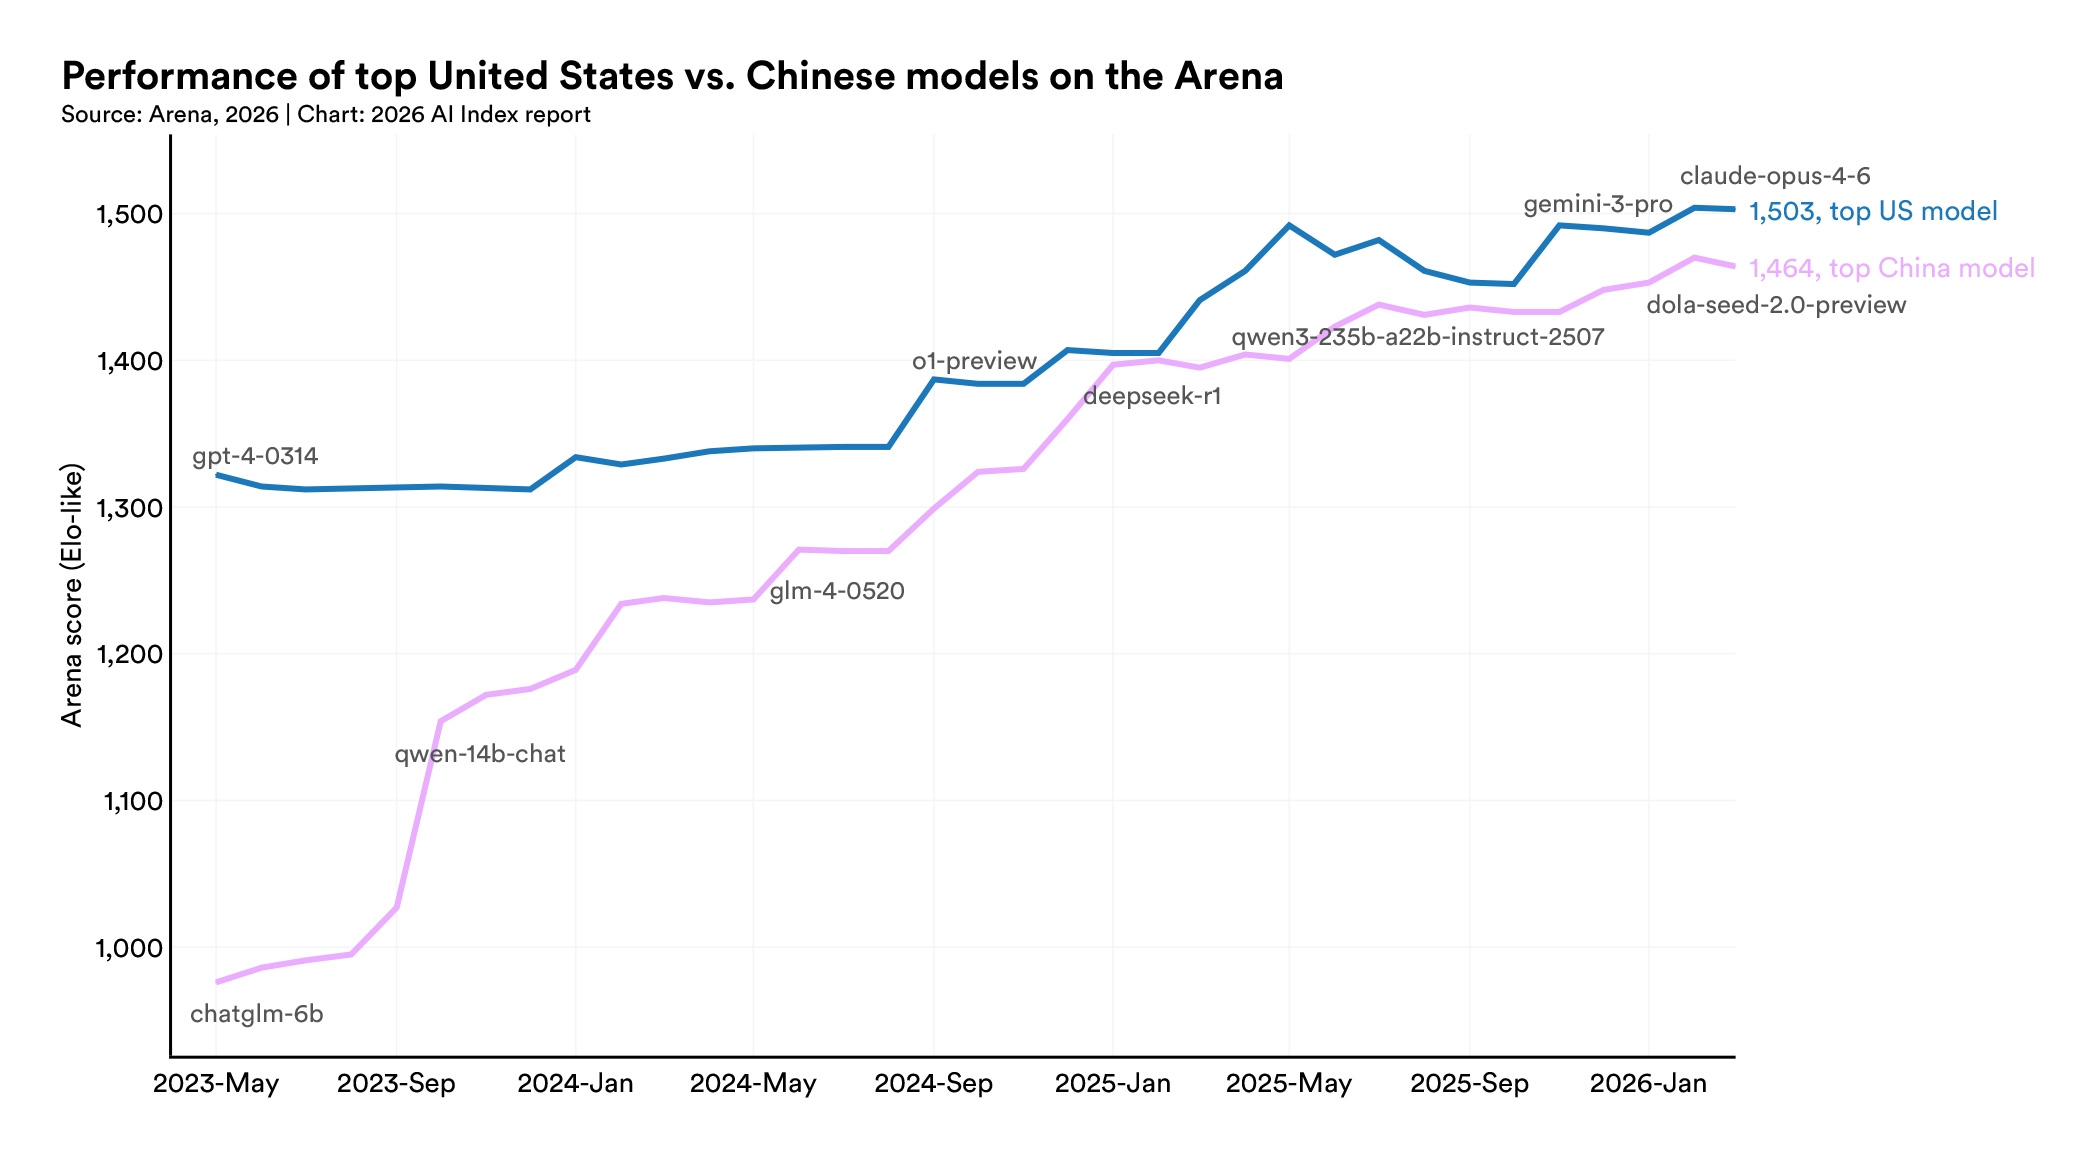
U.S. and Chinese models have traded the lead multiple times since early 2025. In February 2025, DeepSeek-R1 briefly matched the top U.S. model, and as of March 2026 Anthropic’s top model leads by just 2.7%. The U.S. still produces more top-tier AI models and higher-impact patents, while China leads in publication volume, citations, patent output, and industrial robot installations. South Korea stands out for its innovation density, leading the world in AI patents per capita.
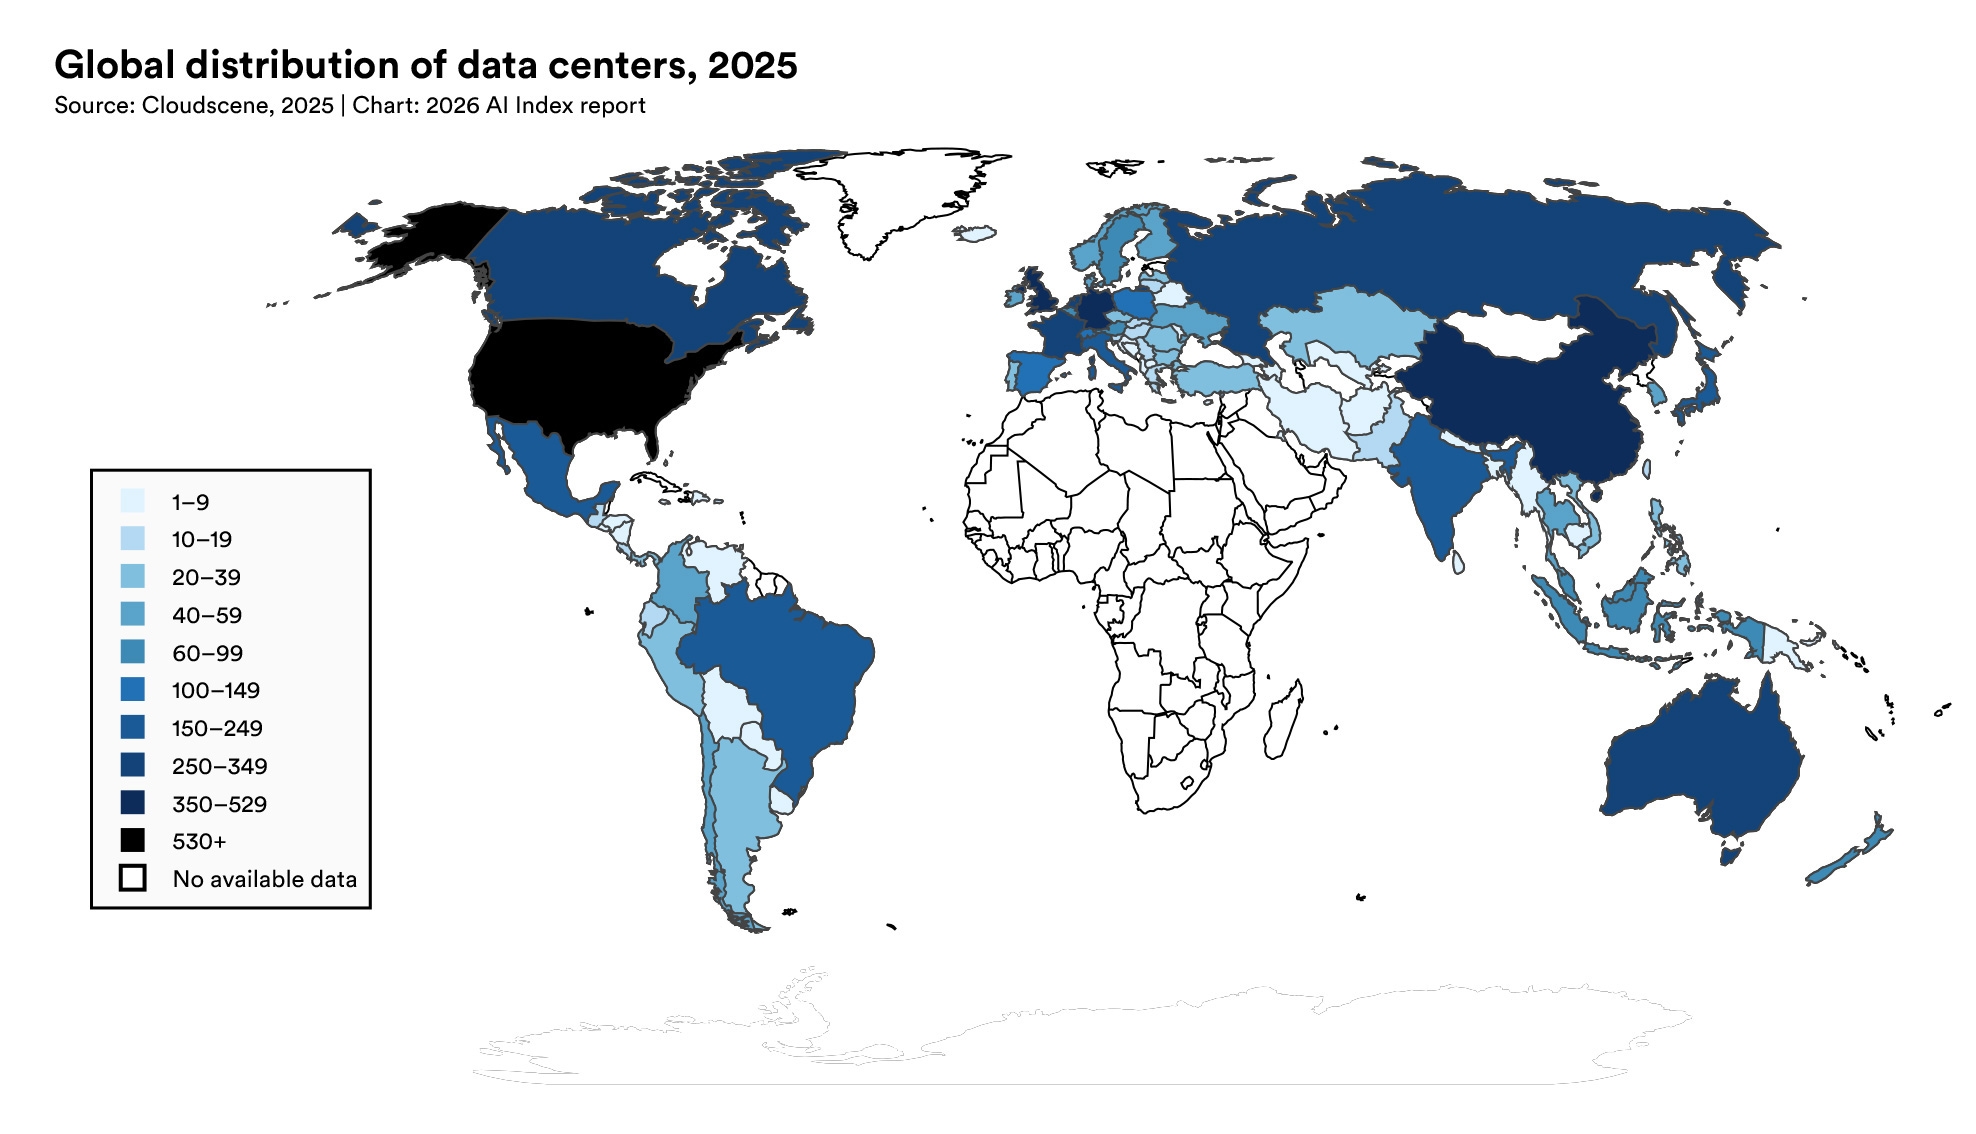
The United States hosts 5,427 data centers, more than 10 times any other country, and it consumes more energy than any other country. A single company, TSMC, fabricates almost every leading AI chip, making the global AI hardware supply chain dependent on one foundry in Taiwan—though a TSMC-U.S. expansion began operations in 2025.
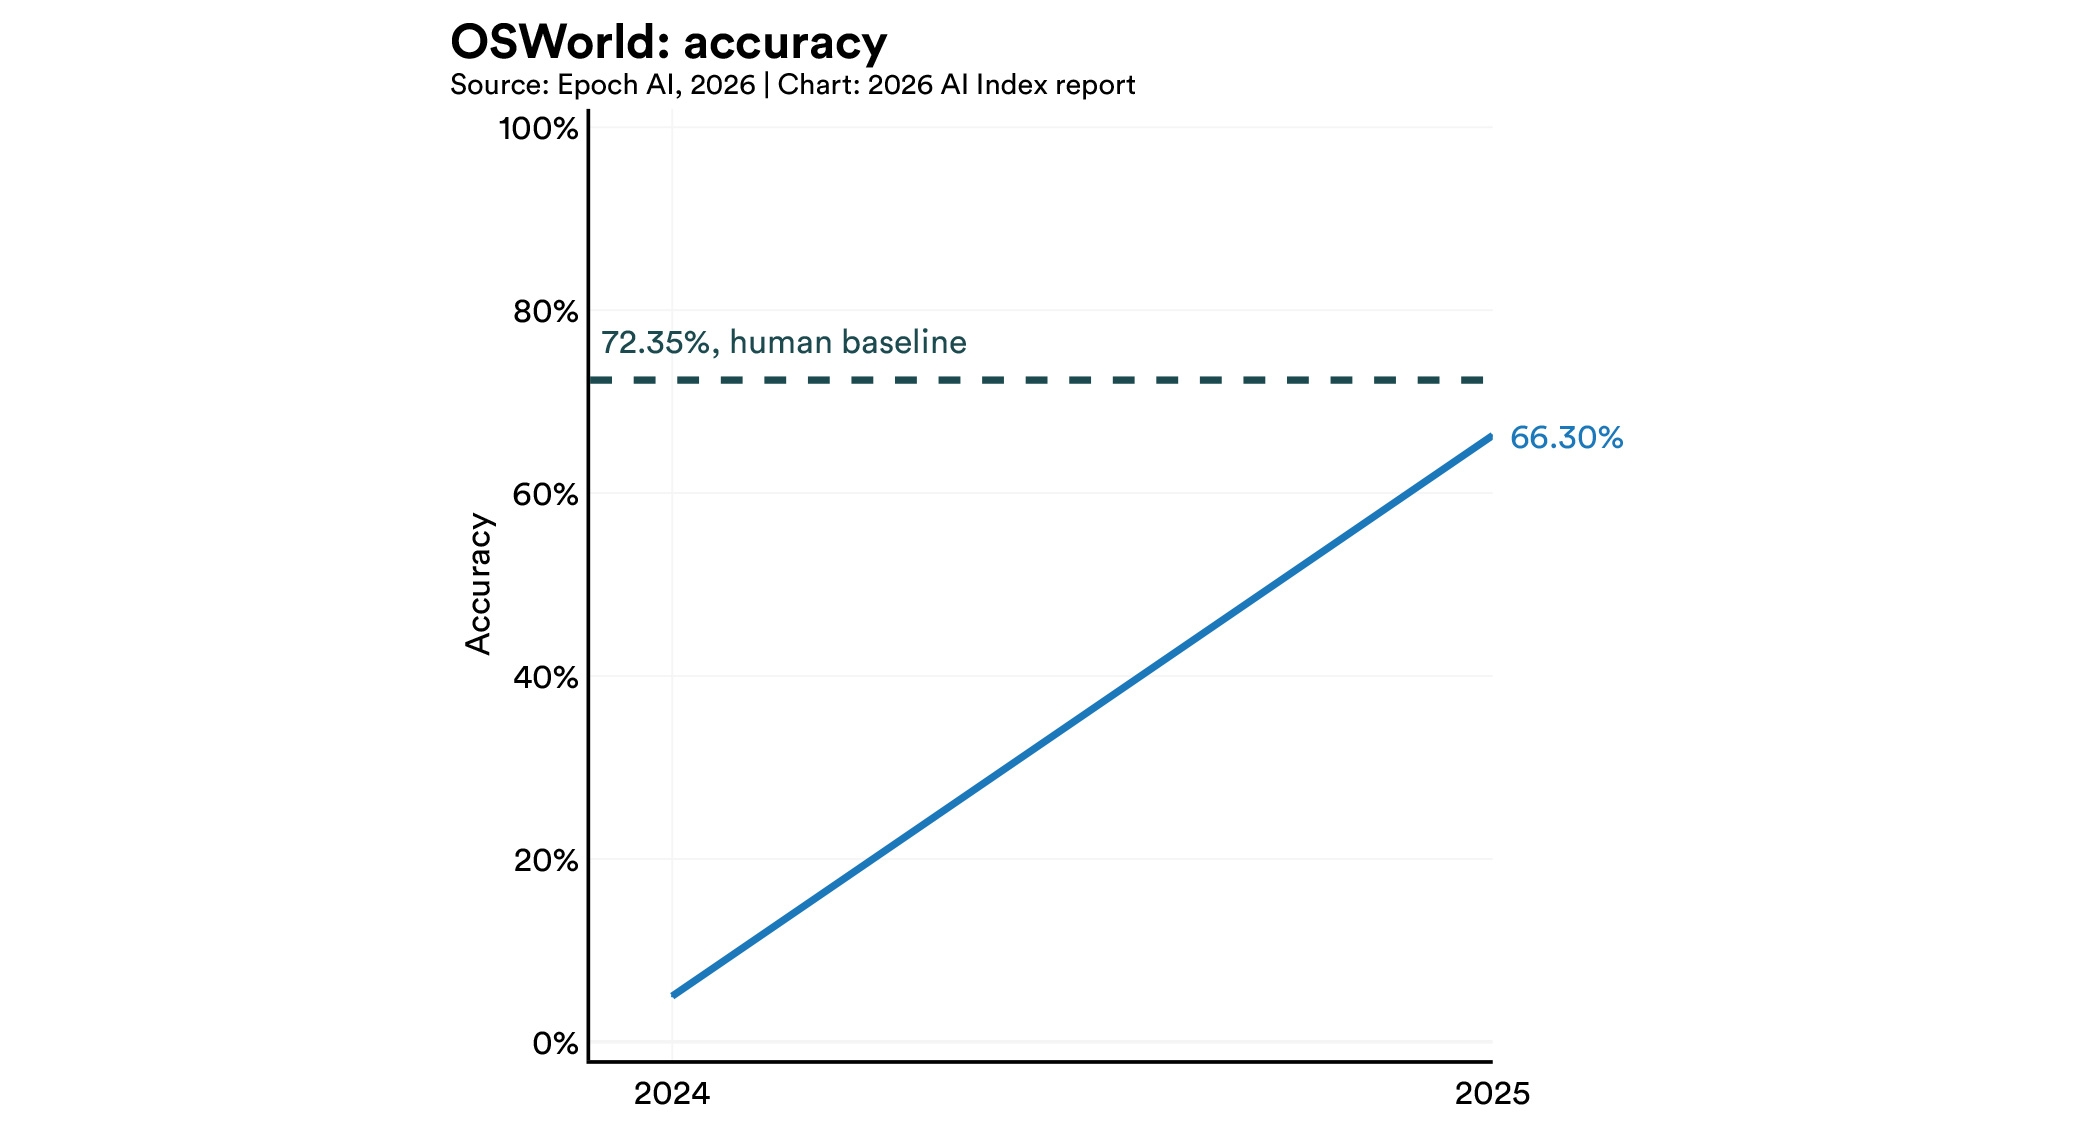
Gemini Deep Think earned a gold medal at IMO, yet the top model reads analog clocks correctly just 50.1% of the time. AI agents made a leap from 12% to ~66% task success on OSWorld, which tests agents on real computer tasks across operating systems, though they still fail roughly 1 in 3 attempts on structured benchmarks.
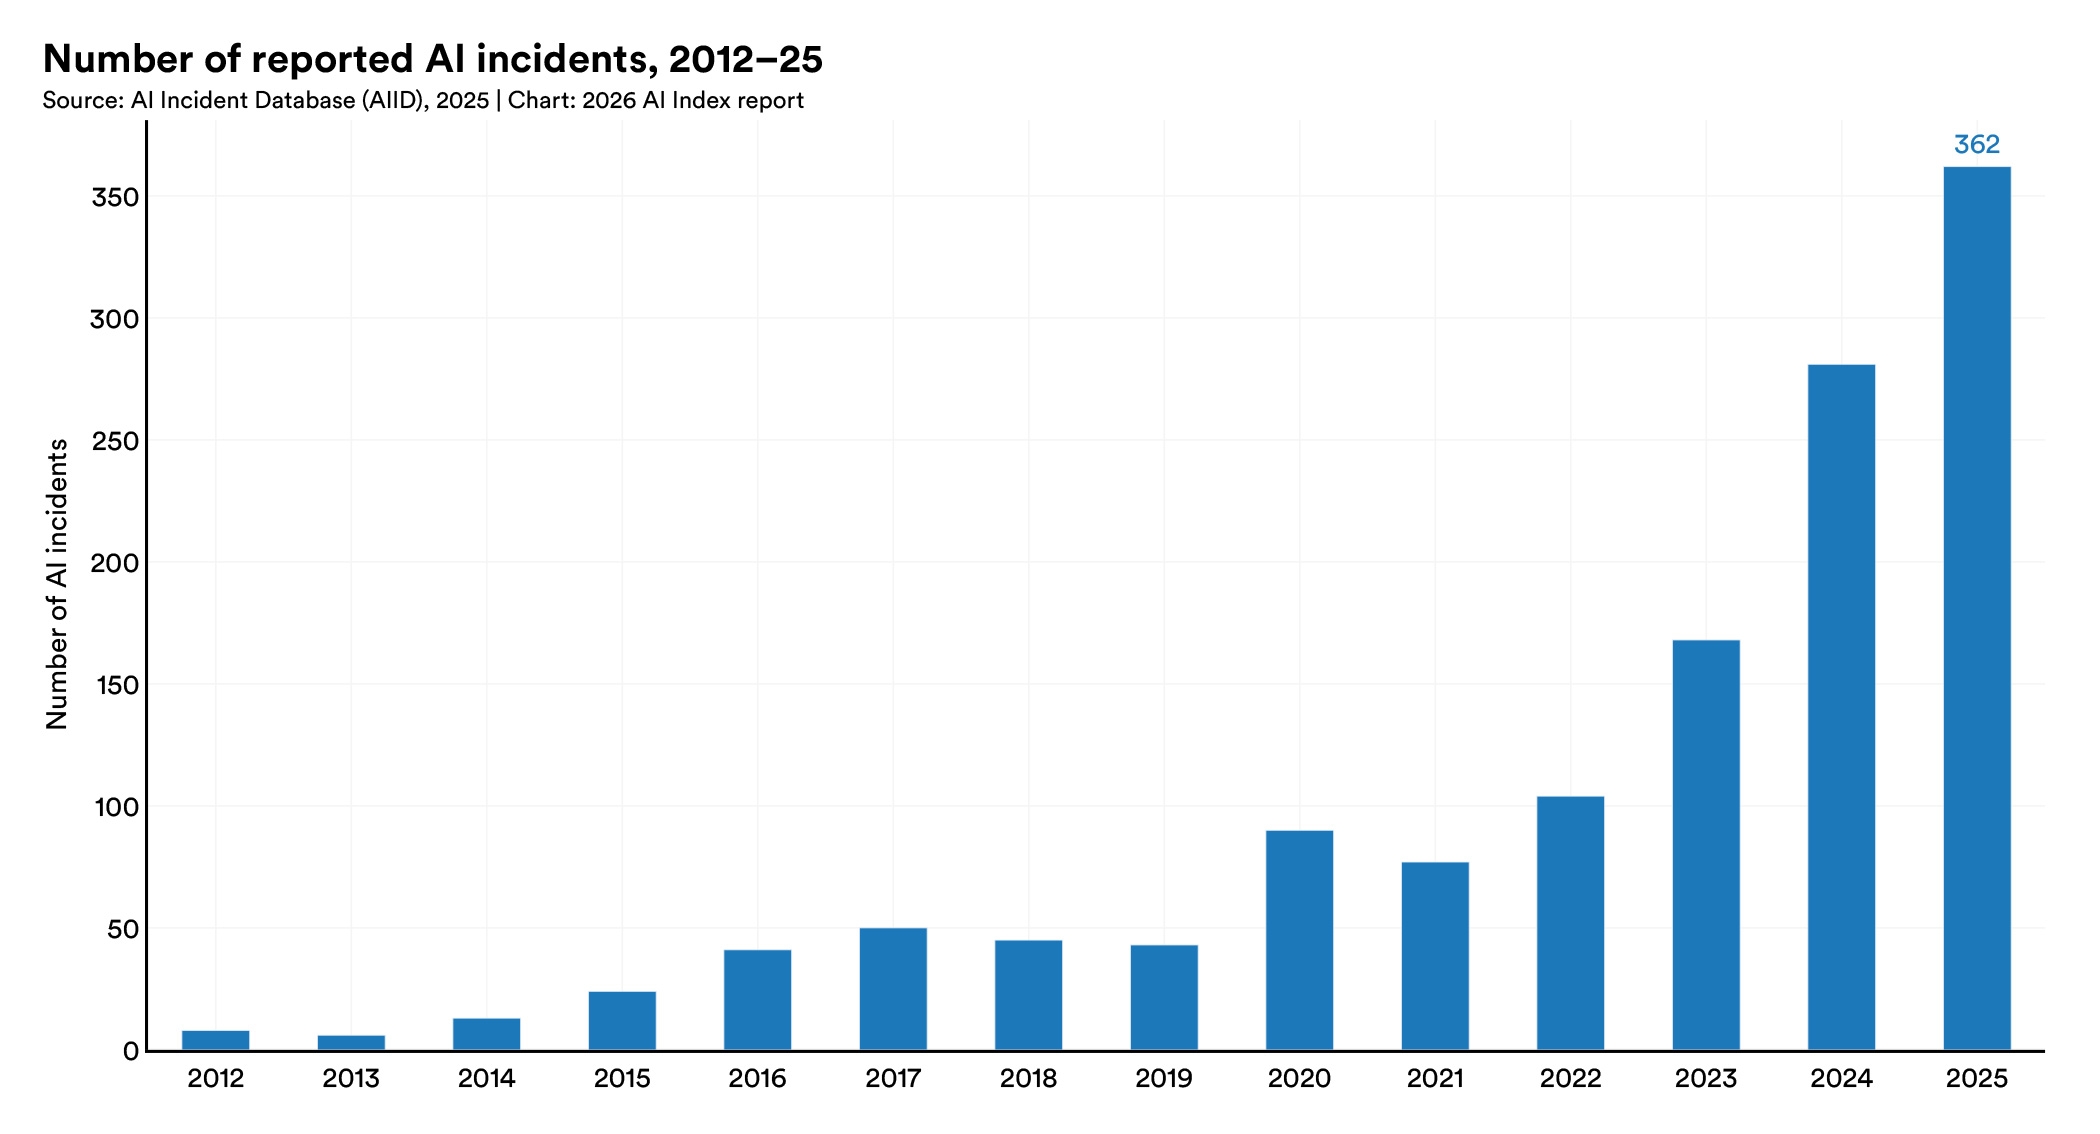
Almost all leading frontier AI model developers report results on capability benchmarks, but reporting on responsible AI benchmarks remains spotty. Documented AI incidents rose to 362, up from 233 in 2024. Adding to the challenge, recent research found that improving one responsible AI dimension, such as safety, can degrade another, such as accuracy.
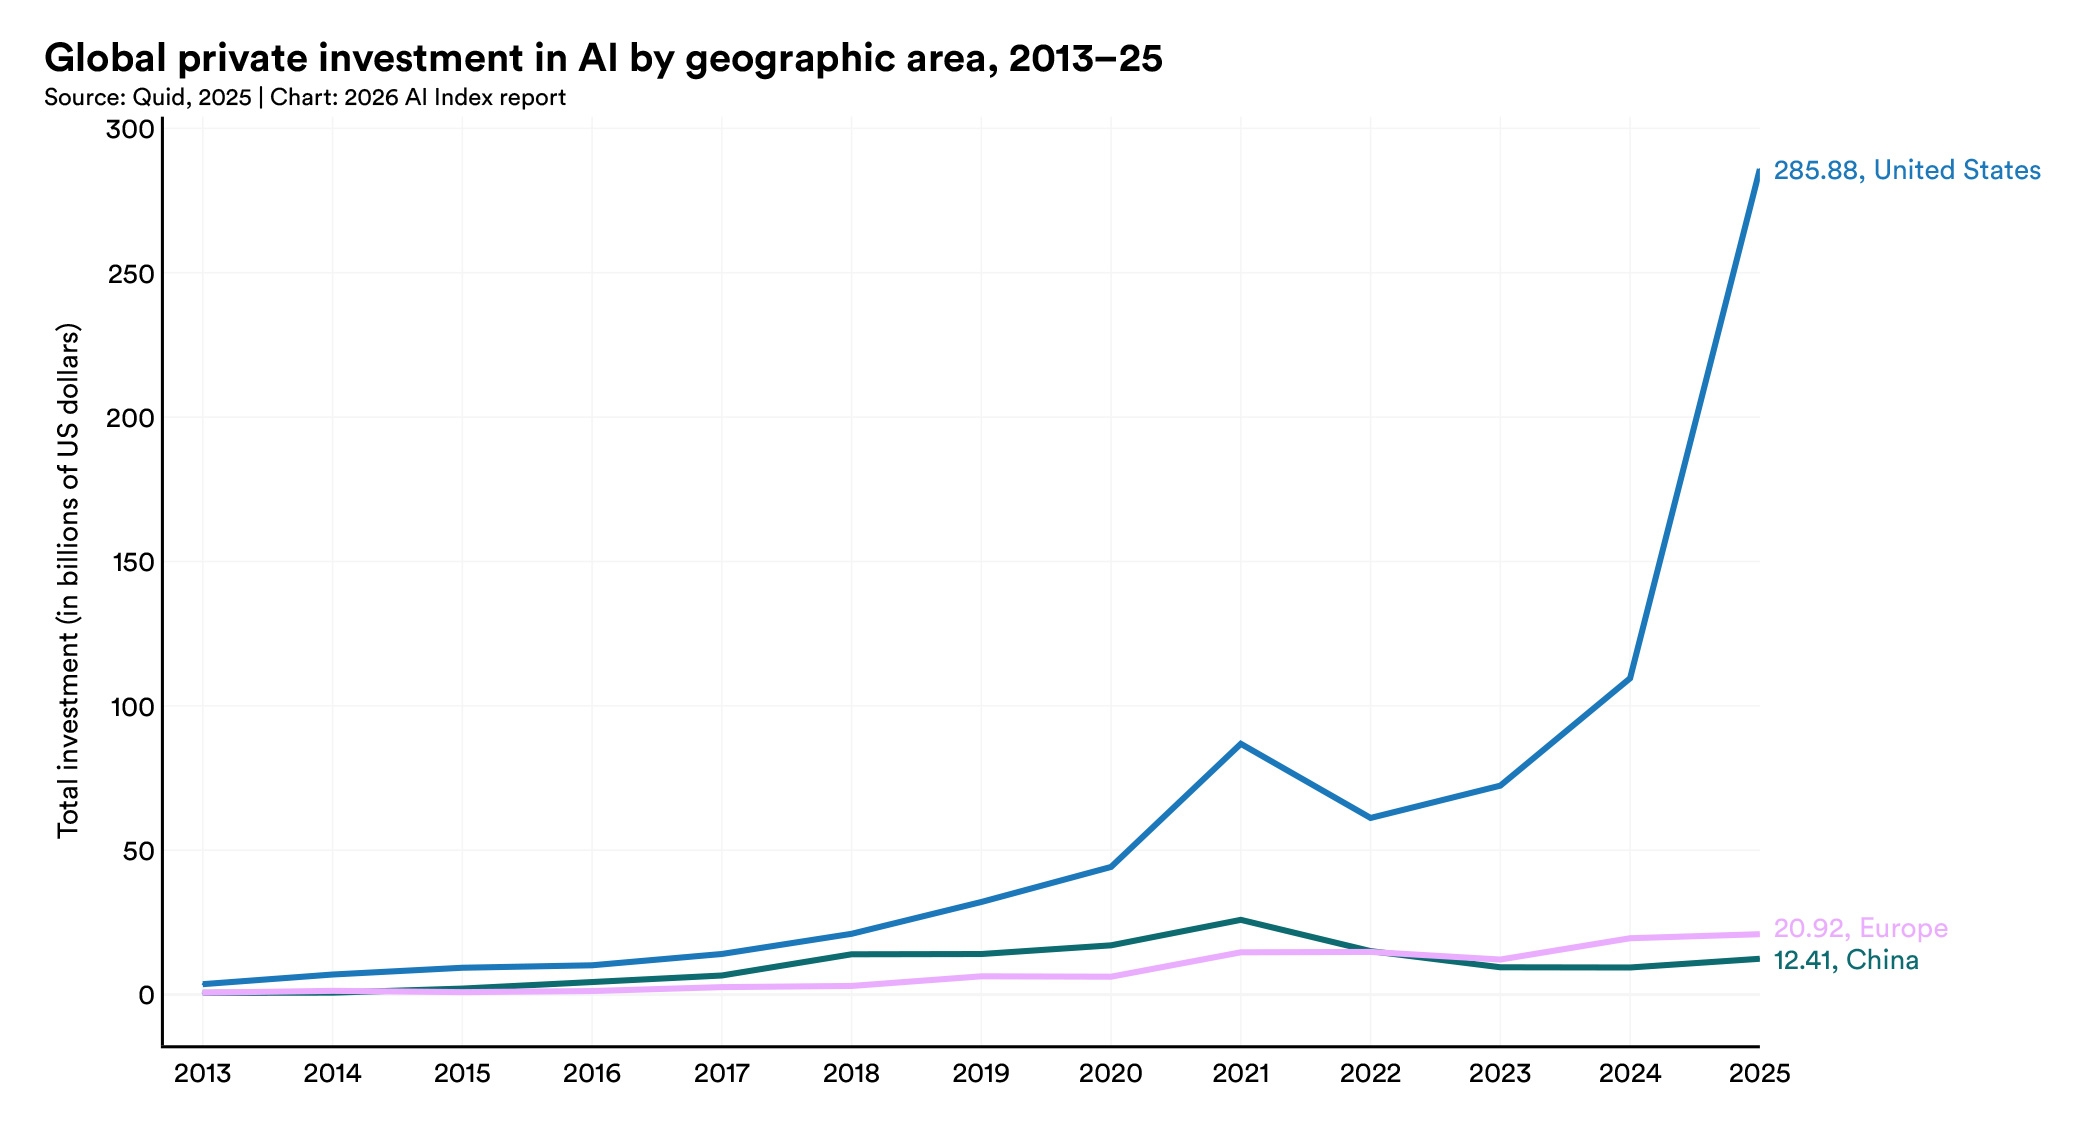
U.S. private AI investment reached $285.9 billion in 2025, more than 23 times the $12.4 billion invested in China—though looking at just private investment figures likely understates China’s total AI spending, given its government guidance funds. The U.S. also led in entrepreneurial activity with 1,953 newly funded AI companies in 2025, more than 10 times the next closest country. However, the number of AI researchers and developers moving to the U.S. has dropped 89% since 2017, with an 80% decline in the last year alone.
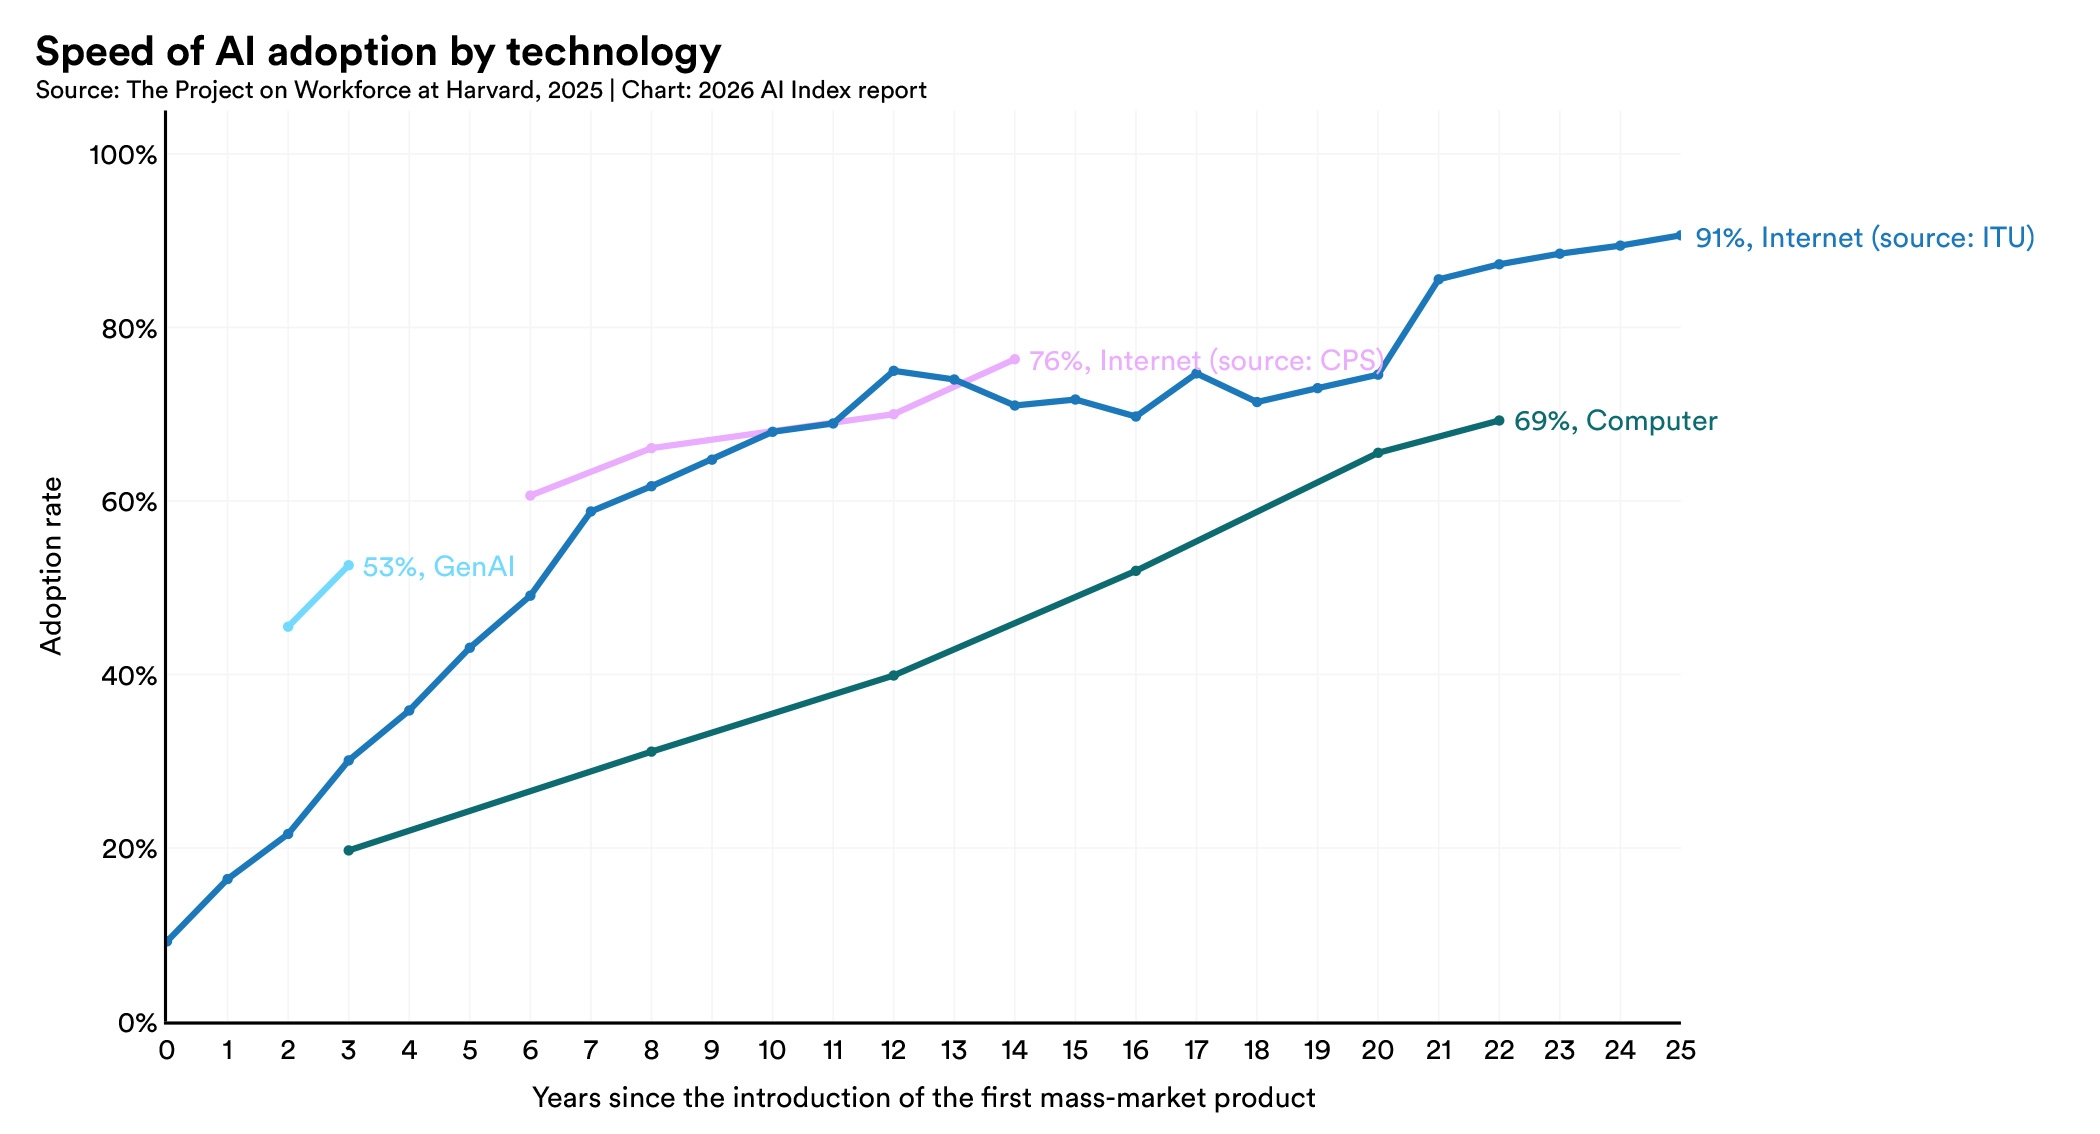
Generative AI reached 53% population adoption within three years, faster than the PC or the internet, though the pace varies by country and correlates strongly with GDP per capita. Some show higher-than-expected adoption, such as Singapore (61%) and the United Arab Emirates (64%), while the U.S. ranks 24th at 28.3%. The estimated value of generative AI tools to U.S. consumers reached $172 billion annually by early 2026, with the median value per user tripling between 2025 and 2026.
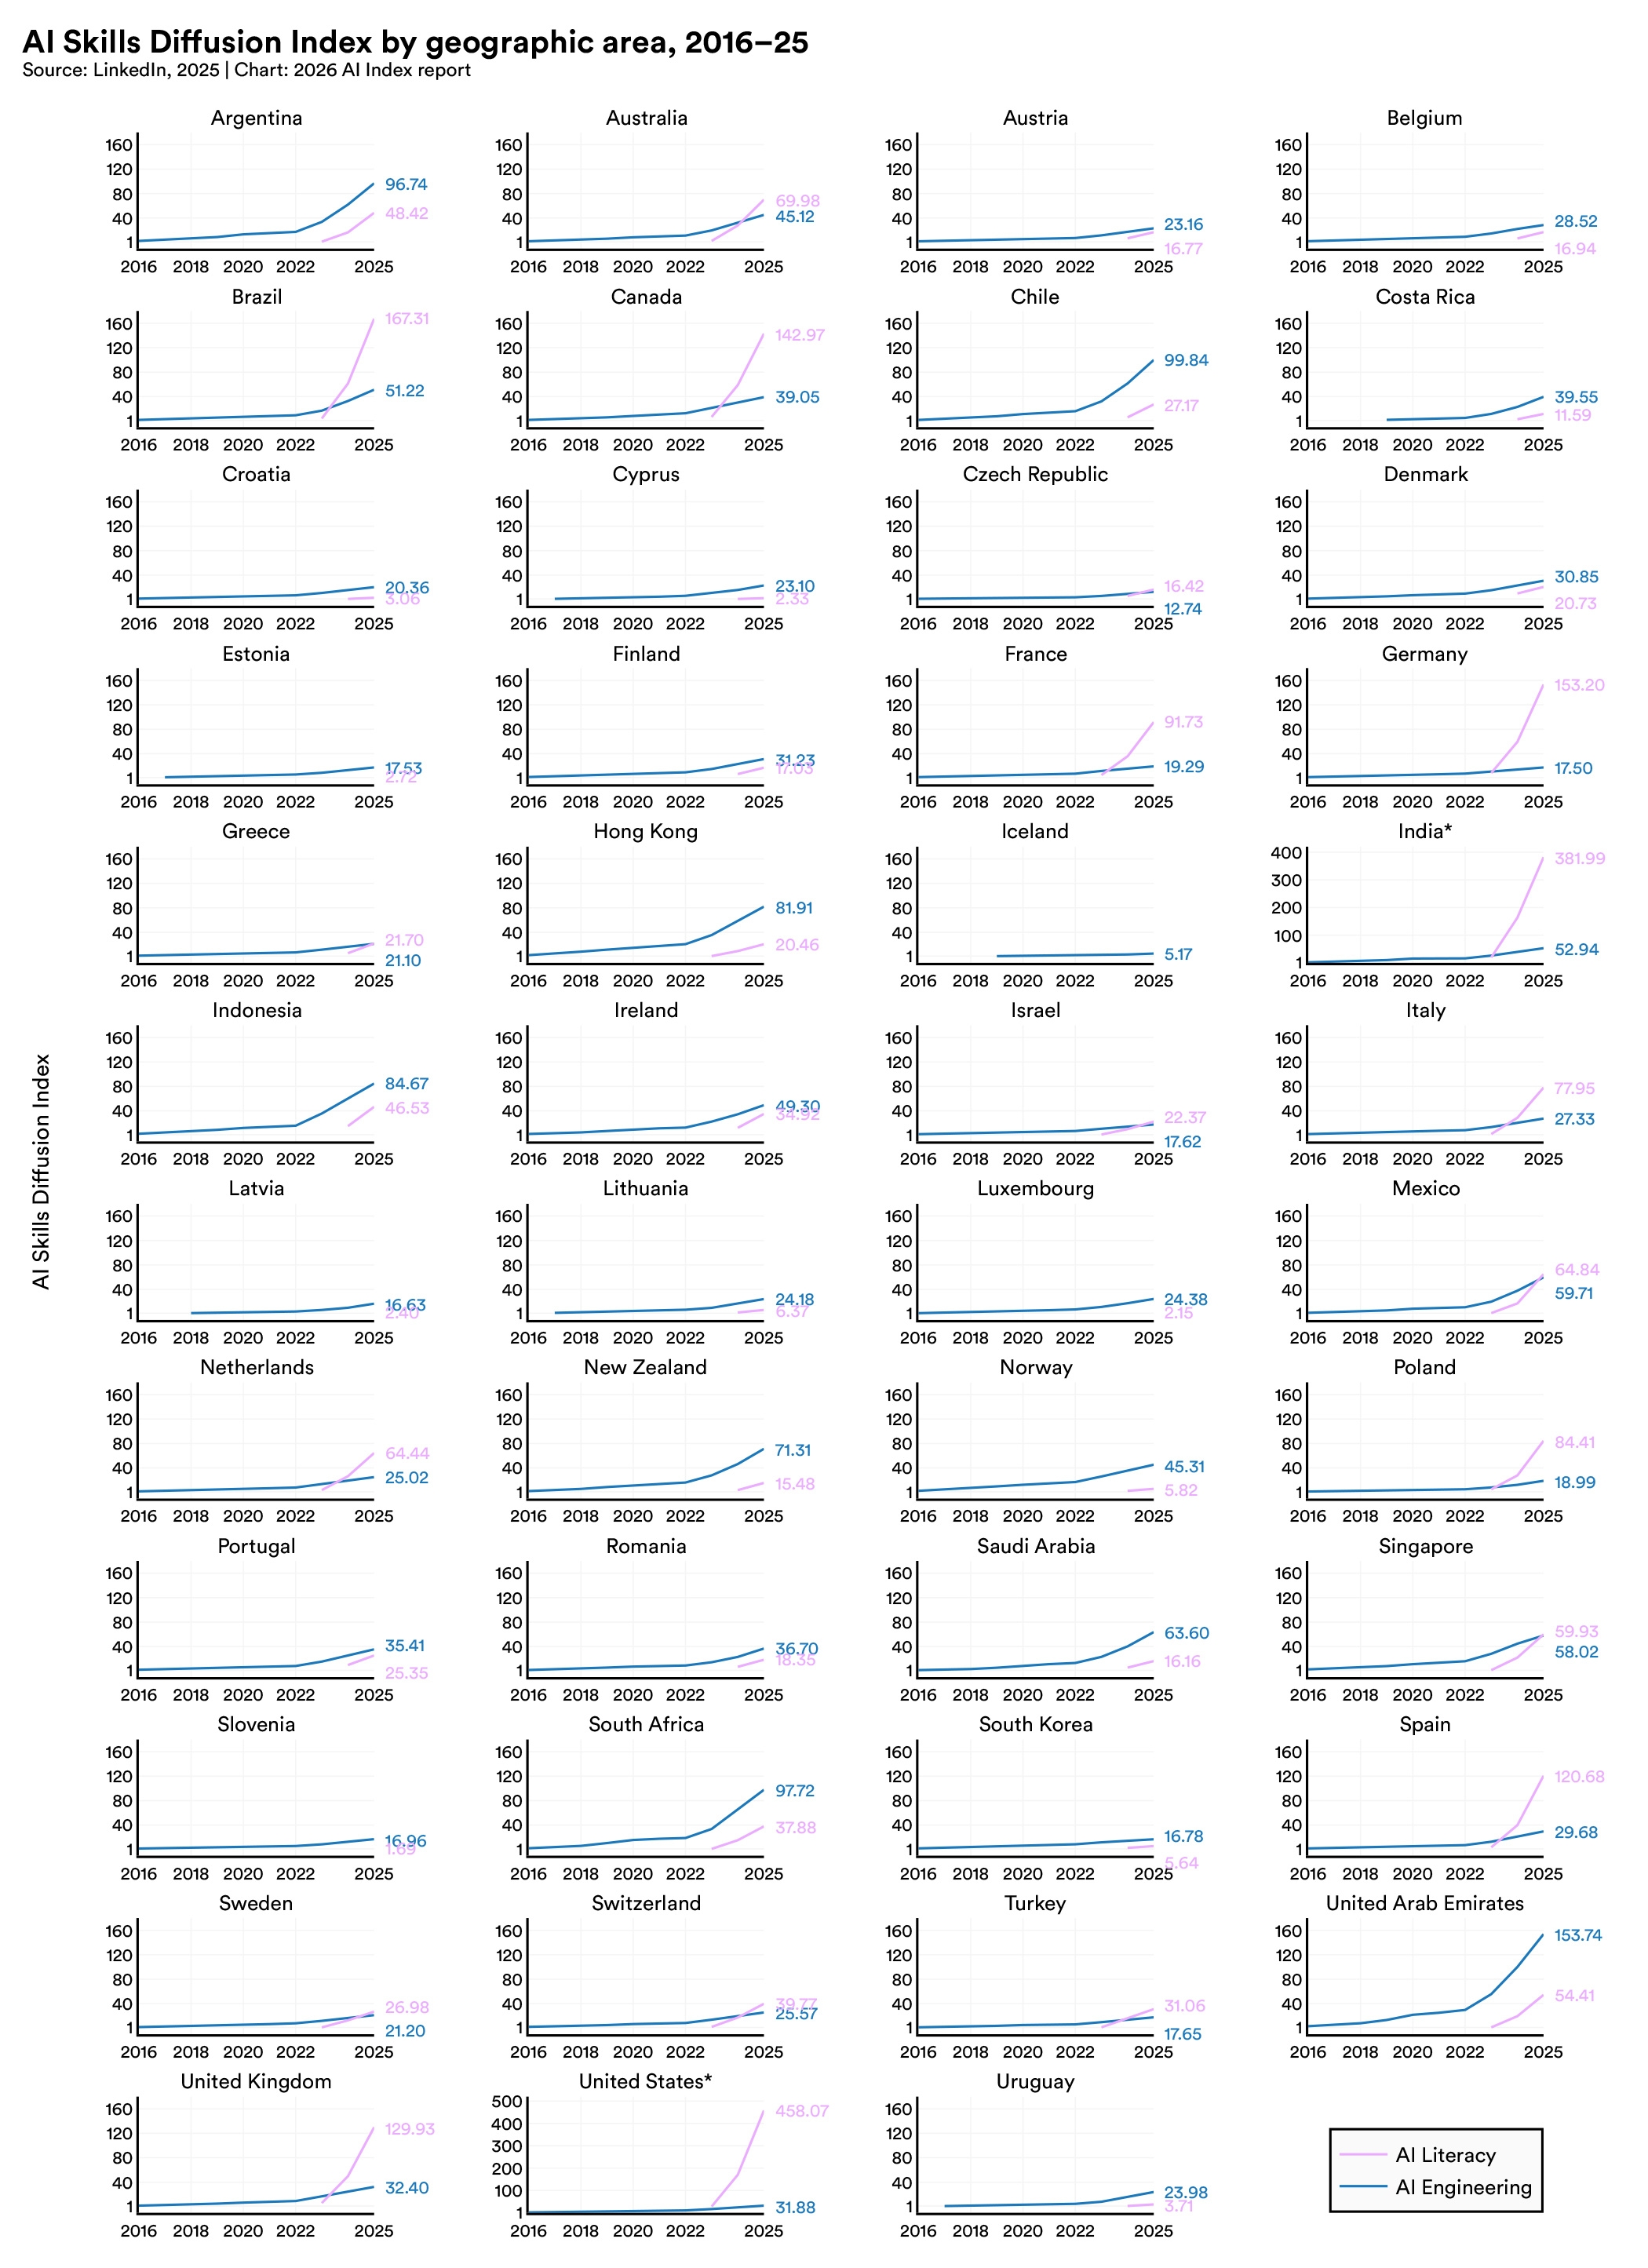
Over 80% of U.S. high school and college students now use AI for school-related tasks, but only half of middle and high schools have AI policies in place, and just 6% of teachers say those policies are clear. Outside the classroom, AI engineering skills are accelerating fastest in the United Arab Emirates, Chile, and South Africa. The number of new AI PhDs in the U.S. and Canada increased 22% from 2022 to 2024, the PhDs that make up that increase took jobs in academia, not in industry.
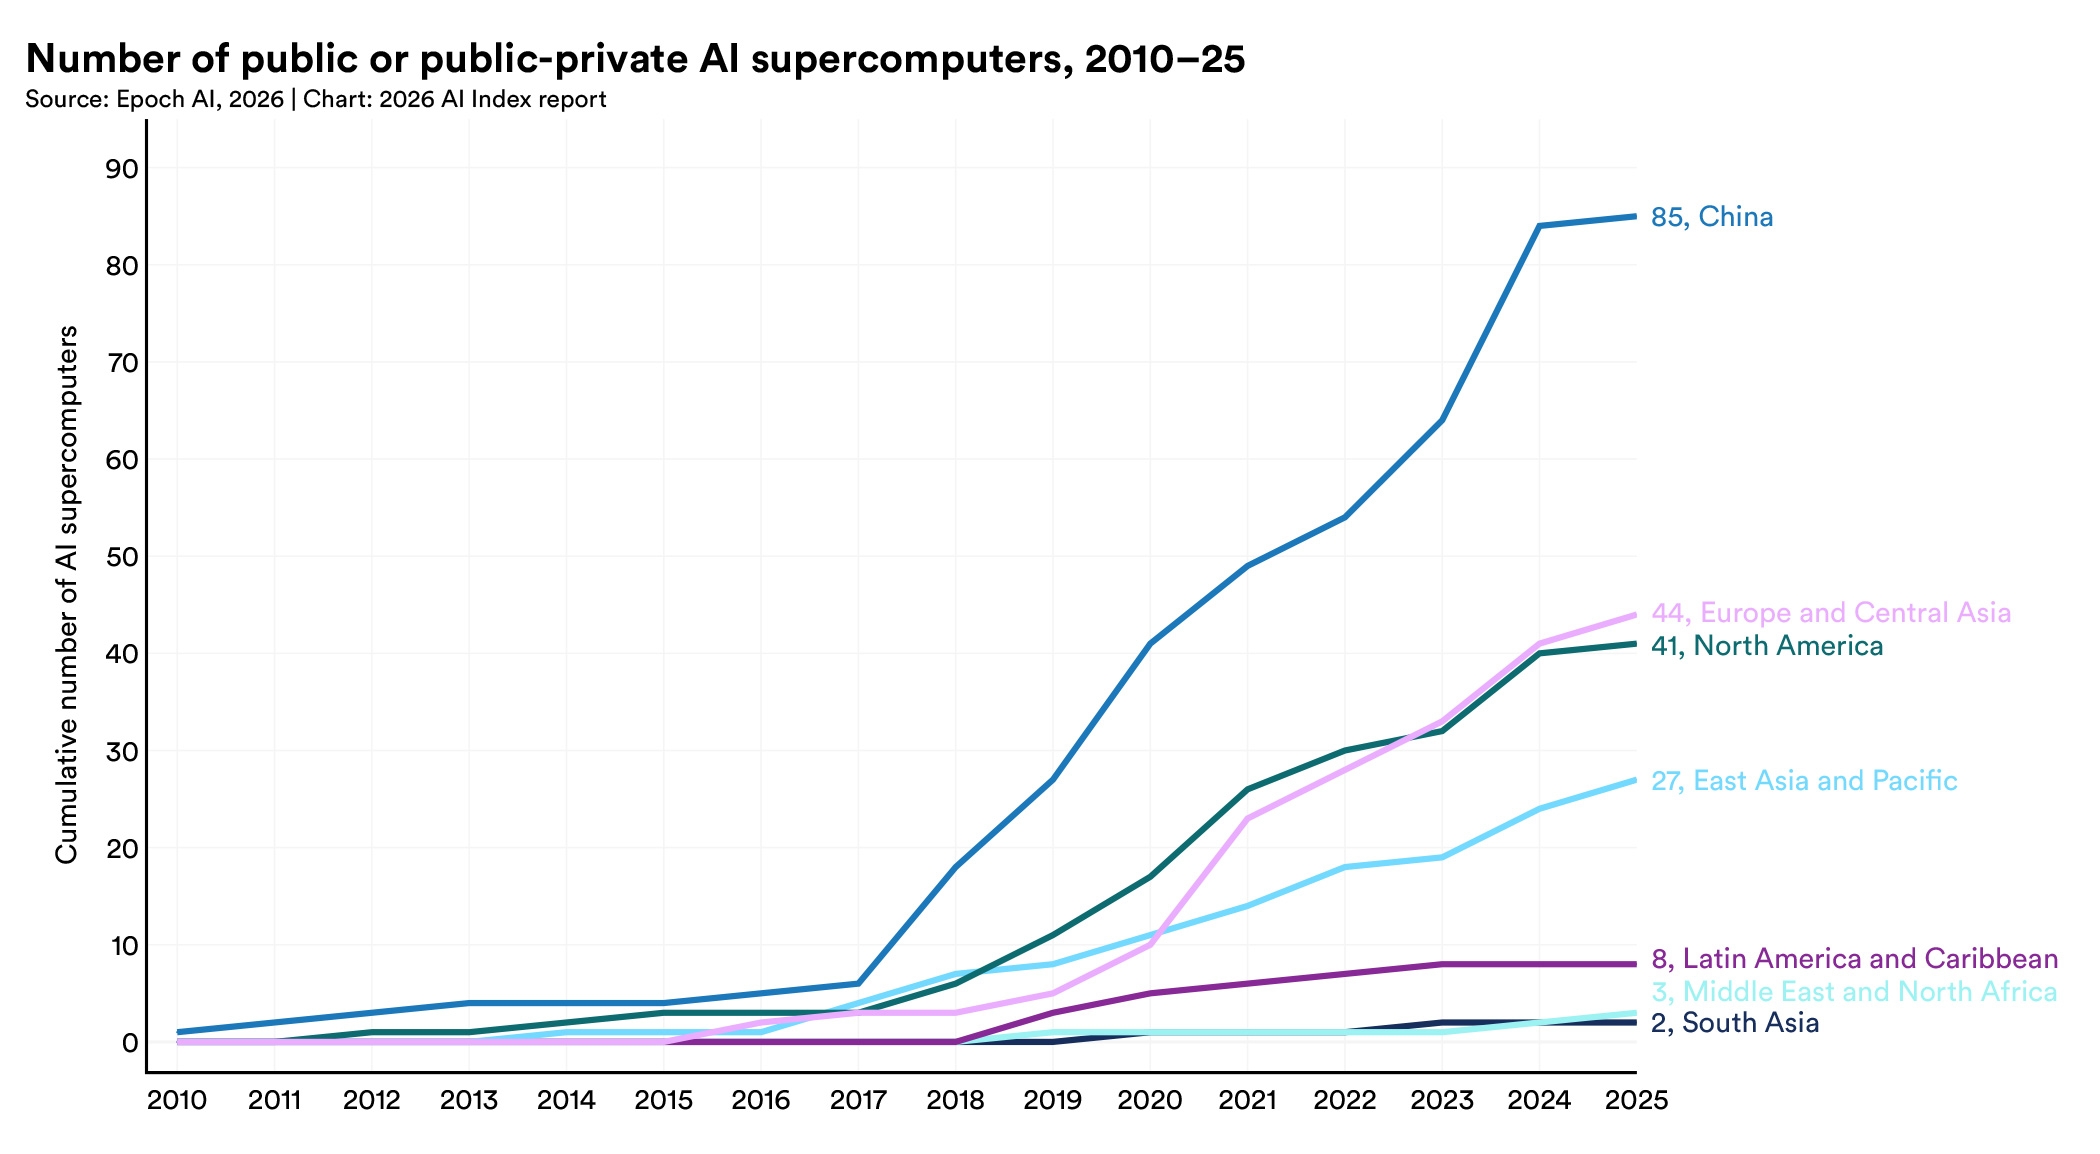
National AI strategies are expanding, particularly among developing economies, and state-backed investments in AI supercomputing are rising in parallel—a sign of growing ambitions for domestic control over AI ecosystems. Yet model production remains concentrated in the U.S. and China. Open-source development is starting to redistribute participation, with contributions from the rest of the world now outpacing Europe and approaching the United States on GitHub, fueling more linguistically diverse models and benchmarks.
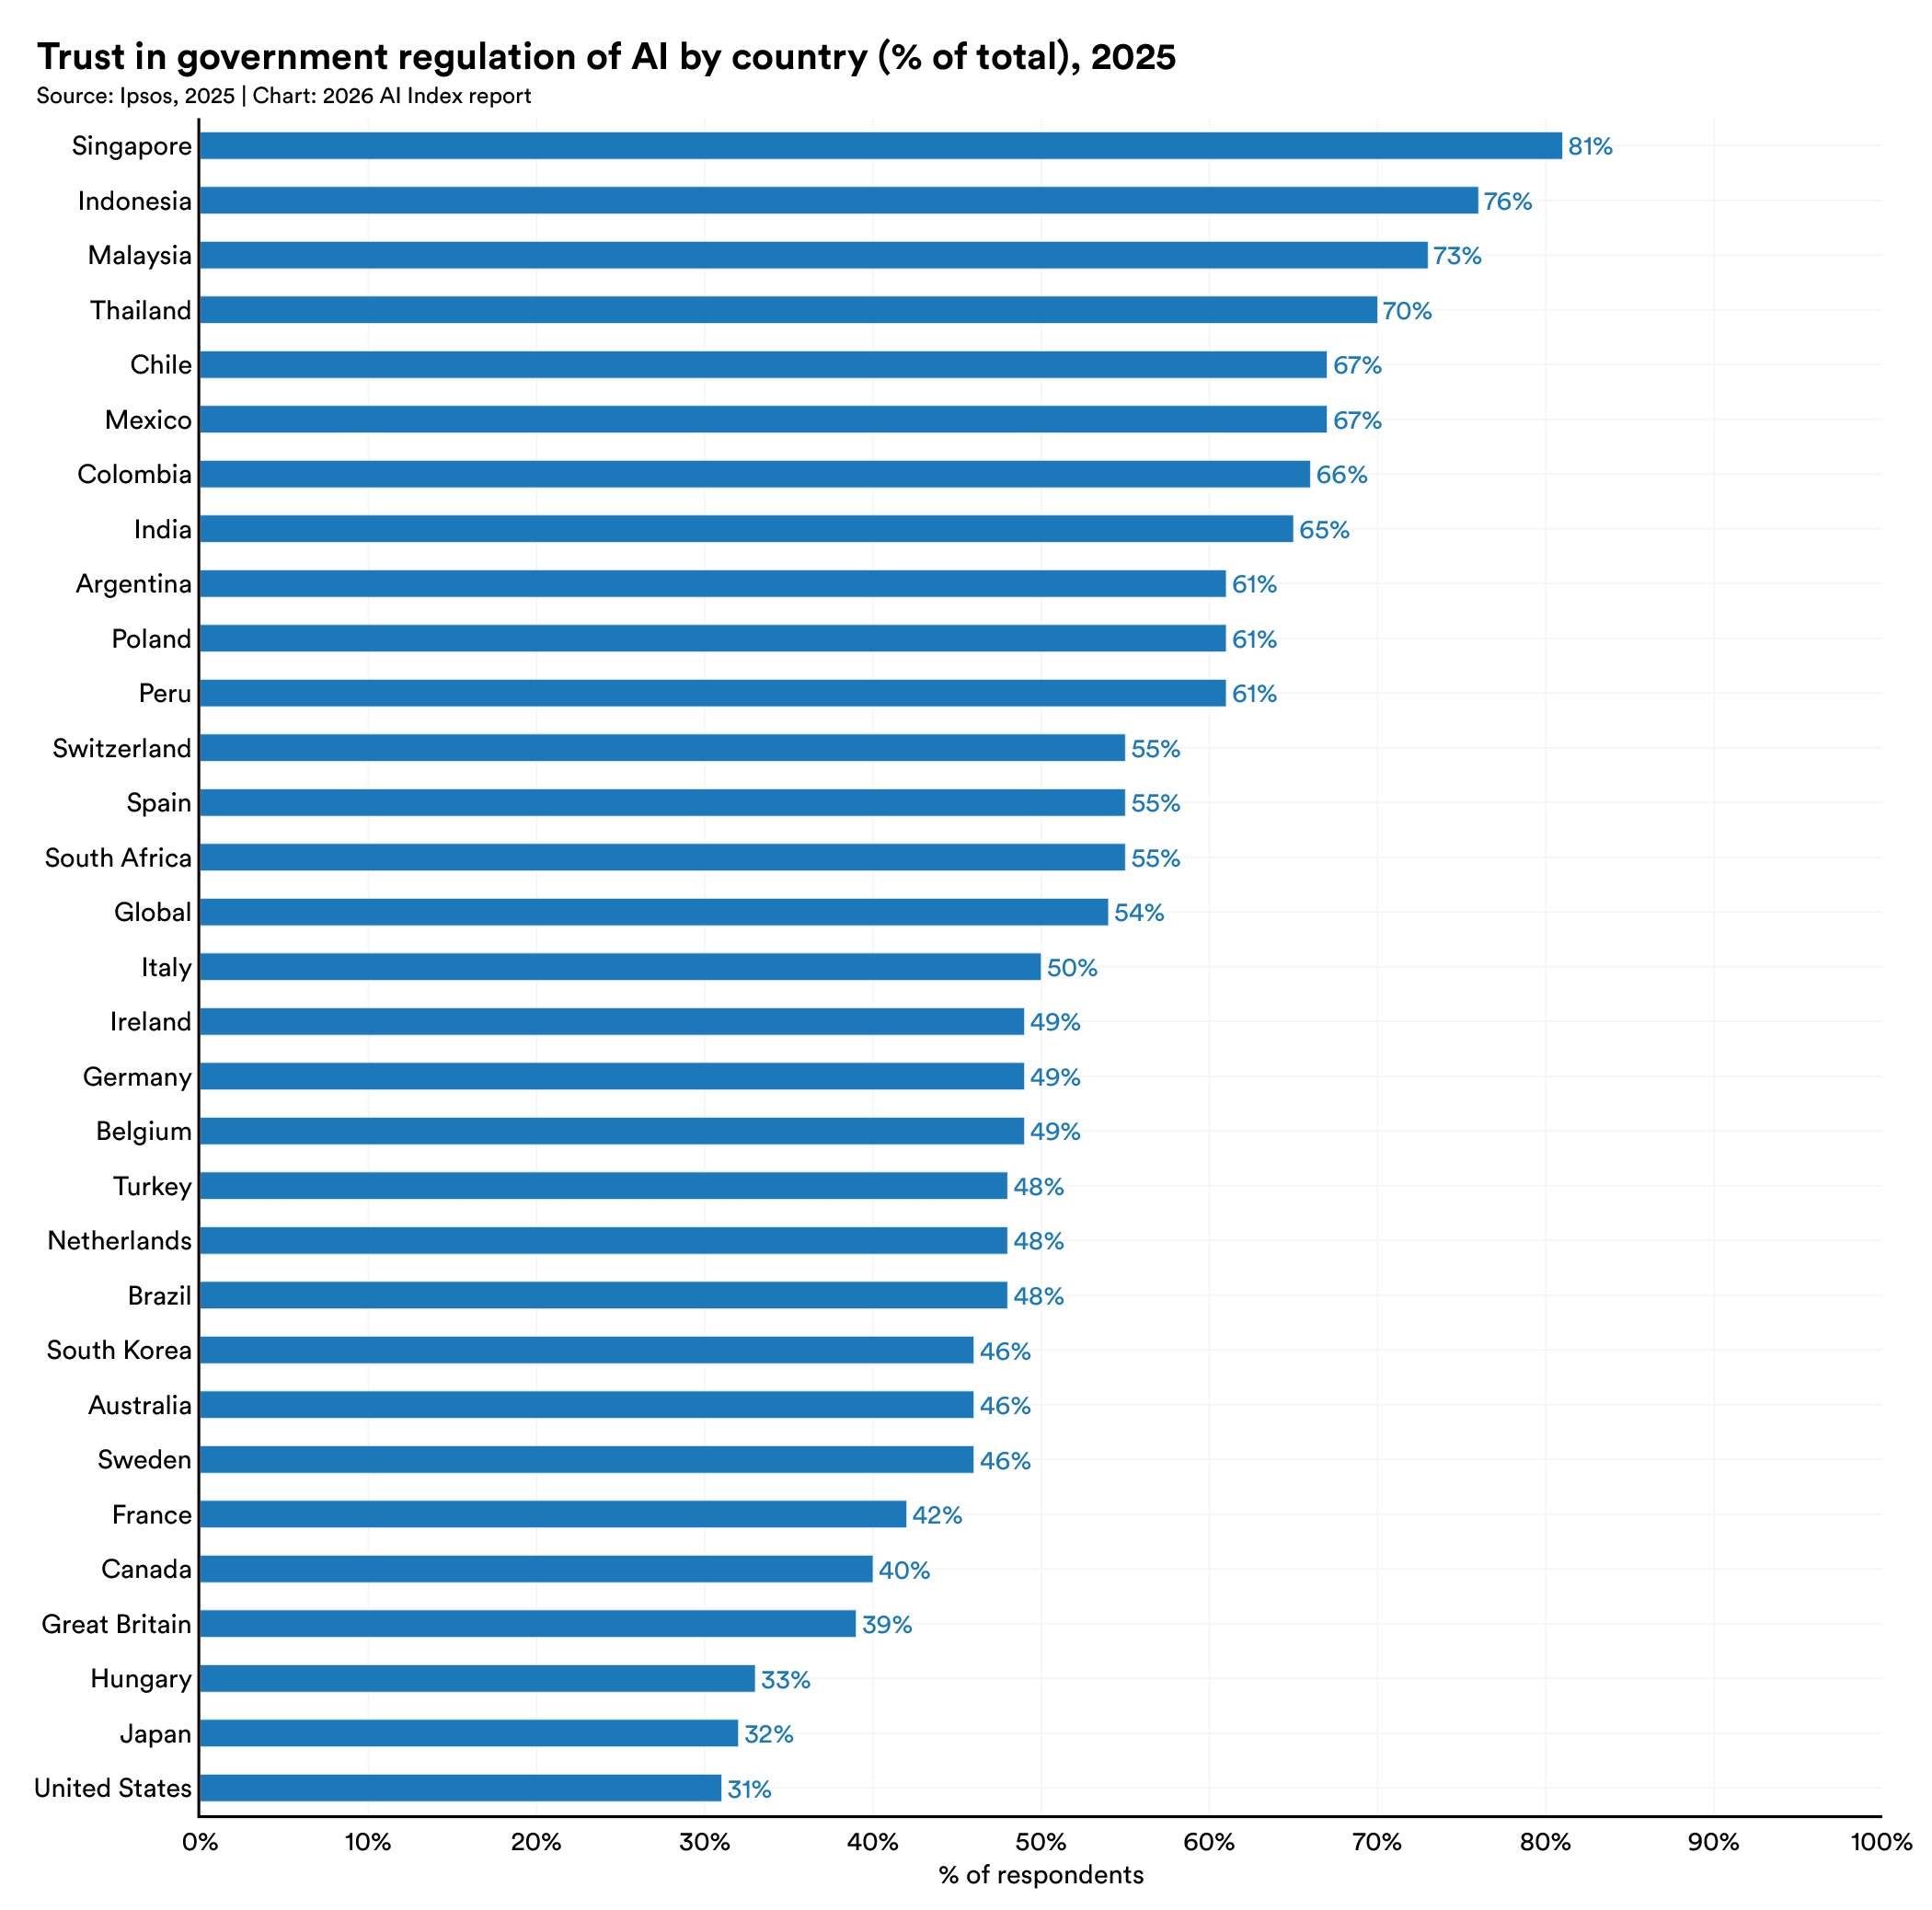
When it comes to how people do their jobs, 73% of experts expect a positive impact, compared with just 23% of the public, a 50-point gap. Similar divides appear for AI's impact on the economy and medical care. Globally, trust in governments to regulate AI varies. Among surveyed countries, the United States reported the lowest level of trust in its own government to regulate AI, at 31%. Globally, the EU is trusted more than the United States or China to regulate AI effectively.
This chapter tracks AI research and development, covering the models and open-source ecosystems driving progress, the infrastructure and environmental footprint supporting it, and the publications, patents and investors shaping the field.
Read Chapter 1
A comprehensive overview of AI performance in 2025, spanning image, video, language, speech, reasoning, robotics, and agentic systems.
Read Chapter 2
This chapter examines responsible AI across the dimensions of safety, fairness, transparency, and governance, and the measurement gaps that persist.
Reach Chapter 3
This chapter analyzes the economic footprint of AI across the private sector and its implications for labor markets, productivity, and the future of work.
Read Chapter 4
This chapter is a new addition in this year’s AI Index report, and looks into AI’s expanding role across scientific domains, such as Biology, Chemistry, Physics and Astronomy.
Read Chapter 5
An overview on AI advancements in medicine, including scientific discovery, clinical applications, patient engagement, and ethical considerations.
Read Chapter 6
This chapter assesses how AI is reshaping education systems and what it means for teaching, learning, and career readiness.
Read Chapter 7
This chapter surveys the global policy landscape, highlighting policymaking and public investment in AI, and the rising emphasis on AI sovereignty.
Read Chapter 8
Drawing on global survey data, this chapter captures public sentiment toward AI, from trust levels, transparency, and regulation to employment and personal relationships.
Read Chapter 9
Support the AI Index in our mission to provide comprehensive, unbiased data on artificial intelligence worldwide. Your support sustains rigorous research, data collection, and analysis that informs policymakers, researchers, journalists, and business leaders—ensuring transparent AI metrics guide humanity toward a better future.
Make a Gift to AI Index
Get the latest news, advances in research, policy work, and education program updates from HAI in your inbox weekly.
Sign Up For Latest News
At Stanford HAI, we believe AI is poised to be the most transformative technology of the 21st century. But its benefits won’t be evenly distributed unless we guide its development thoughtfully.

Welcome to the seventh edition of the AI Index report. The 2024 Index is our most comprehensive to date and arrives at an important moment when AI’s influence on society has never been more pronounced.

The AI Index is an independent initiative at the Stanford Institute for Human-Centered Artificial Intelligence (HAI), led by the AI Index Steering Committee, an interdisciplinary group of experts from across academia and industry.

The AI Index is an independent initiative at the Stanford Institute for Human-Centered Artificial Intelligence (HAI), led by the AI Index Steering Committee, an interdisciplinary group of experts from across academia and industry.

This year we significantly expanded the amount of data available in the report, worked with a broader set of external organizations to calibrate our data, and deepened our connections with Stanford HAI.

The AI Index Report tracks, collates, distills, and visualizes data relating to artificial intelligence.
Its mission is to provide unbiased, rigorous, and comprehensive data for policymakers, researchers, journalists, executives, and the general public to develop a deeper understanding of the complex field of AI.

Artificial Intelligence has leapt to the forefront of global discourse, garnering increased attention from practitioners, industry leaders, policymakers, and the general public. The diversity of opinions and debates gathered from news articles this year illustrates just how broadly AI is being investigated, studied, and applied. However, the field of AI is still evolving rapidly and even experts have a hard time understanding and tracking progress across the field.

Artificial Intelligence has leapt to the forefront of global discourse, garnering increased attention from practitioners, industry leaders, policymakers, and the general public. The diversity of opinions and debates gathered from news articles this year illustrates just how broadly AI is being investigated, studied, and applied. However, the field of AI is still evolving rapidly and even experts have a hard time understanding and tracking progress across the field.